Titanium JIRA Archive
Titanium SDK/CLI (TIMOB)

[TIMOB-14073] Memory leak in Ti.Buffer

GitHub Issuen/a
TypeBug
Priorityn/a
StatusOpen
ResolutionUnresolved
Affected Version/sn/a
Fix Version/sn/a
Componentsn/a
Labelsbuffer, heap, ios, memory, simulator
ReporterCarter Lathrop
AssigneeUnknown
Created2013-05-21T11:45:06.000+0000
Updated2018-02-28T20:03:15.000+0000

Description

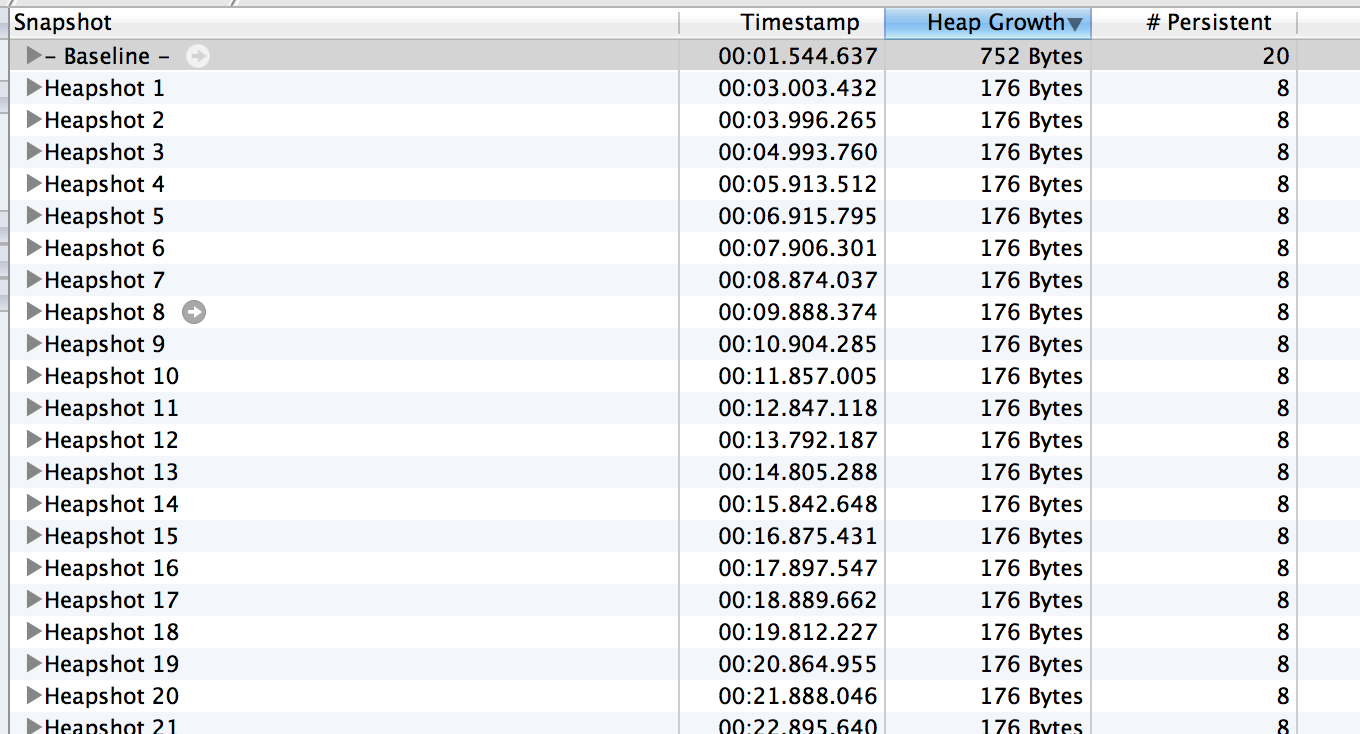
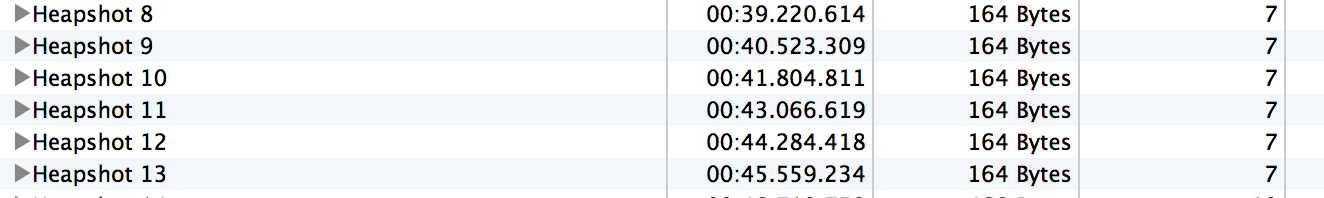
I am not sure if I have gotten everything right, but from what I can see there is a memory leak every time I do a write to a Ti.Buffer.
var buffer = Ti.createBuffer({length: 1000});
var pos = 0;
var id = setInterval(OnInterval, 1000);

function OnInterval() {
	buffer[pos++] = 1;	
}
Every time OnInterval is called there is a memory loss of 176 bytes. To rule out loss from the interval mechanism I did a test with a button instead:
var buffer = Ti.createBuffer({length: 1000});
var pos = 0;

var win = Ti.UI.createWindow();
var button = Ti.UI.createButton({ title: 'Click me'});
button.addEventListener("click", OnClick);
win.add(button);
win.open();

function OnClick() {
	buffer[pos++] = 1;
}
In that case the heap growth was 164 bytes.

Attachments

FileDateSize
Screen Shot 2013-05-21 at 13.33.03.png2013-05-21T11:45:06.000+0000220531
Screen Shot 2013-05-21 at 13.43.39.png2013-05-21T11:45:06.000+000058920

Comments

  1. Malcolm Christie 2014-08-08

    I'm having a very similar issue with an apparent memory leak using Ti.Buffer. I'm reading though a filestream to read sections of it to upload in chunks, this is a stripped down sample of what I'm doing:
       var stream = file.open( Ti.Filesystem.MODE_READ );
       
       var size = 1024 * 256;
       var buffer = Ti.createBuffer({length: size});
       
       for (i = 0; i < 10; i++) {
           bytes_read = stream.read( buffer, 0, size );
       
           if (i < 9) buffer.clear();
       }
       var blob = buffer.toBlob();
       
       stream.close();
       
       buffer.clear();
       
    I've tried various things such as buffer.release() instead of buffer.clear() etc, but the memory footprint grows by about 520KB every time I write to the buffer, and never goes down again. I can't seem to post a screenshot, but I'm seeing hundreds of records like this in instruments:
       #	Address	Category	Timestamp	Live	Size	Responsible Library	Responsible Caller
       2	0x8143000	Malloc 520.00 KB	00:21.676.535	•	520.00 KB	Foundation	_NSMutableDataGrowBytes
       3	0x80c1000	Malloc 520.00 KB	00:21.672.005	•	520.00 KB	Foundation	-[NSConcreteMutableData initWithLength:]
       4	0x7fd7000	Malloc 520.00 KB	00:21.055.179	•	520.00 KB	Foundation	_NSMutableDataGrowBytes
       5	0x7f55000	Malloc 520.00 KB	00:21.039.952	•	520.00 KB	Foundation	-[NSConcreteMutableData initWithLength:]
       6	0x7e7b000	Malloc 520.00 KB	00:20.452.586	•	520.00 KB	Foundation	_NSMutableDataGrowBytes
       7	0x7df9000	Malloc 520.00 KB	00:20.448.967	•	520.00 KB	Foundation	-[NSConcreteMutableData initWithLength:]
       8	0x7d77000	Malloc 520.00 KB	00:19.840.489	•	520.00 KB	Foundation	_NSMutableDataGrowBytes
       9	0x7cf5000	Malloc 520.00 KB	00:19.836.874	•	520.00 KB	Foundation	-[NSConcreteMutableData initWithLength:]
       10	0x7c0b000	Malloc 520.00 KB	00:19.239.308	•	520.00 KB	Foundation	_NSMutableDataGrowBytes
       11	0x7b89000	Malloc 520.00 KB	00:19.232.946	•	520.00 KB	Foundation	-[NSConcreteMutableData initWithLength:]
       12	0x7b07000	Malloc 520.00 KB	00:18.628.473	•	520.00 KB	Foundation	_NSMutableDataGrowBytes
       13	0x7a85000	Malloc 520.00 KB	00:18.624.278	•	520.00 KB	Foundation	-[NSConcreteMutableData initWithLength:]
       

JSON Source