Problem description
Code Profiler on Android (both classic and Alloy projects) is returning different inconsistent outputs for every run.
Sample code:
function doClick(e) {
	Ti.API.info('#### doCLick function ');

	setTimeout(function(){
		alert('doClick function');
	}, 2000);
}

function showAlert() {
	Ti.API.info('#### showAlert function ');
	setTimeout(function(){
		alert('showAlert function');
	}, 2000);
}


var win = Titanium.UI.createWindow({
	title : 'Tab 1',
	backgroundColor : '#fff'
});

var label1 = Titanium.UI.createLabel({
	color : '#999',
	text : 'I am Window 1',
	font : {
		fontSize : '24dp',
		fontFamily : 'Helvetica Neue'
	},
	textAlign : 'center',
	width : 'auto'
});
label1.addEventListener('click', showAlert);

win.add(label1);

var button = Ti.UI.createButton({
	bottom : '10',
	title : 'click'
});
button.addEventListener('click', doClick);


win.add(button);
win.add(label1);

win.open();
Steps to reproduce
1. Grab the sample code, Build and run the Code Profiler on Android device (tested with Google Galaxy Nexus 4.2.2)
2. Once the app is started, start recording a snapshot with the Profiler.
3. Click on the Label and wait for the alert to appear('showAlert' function is triggered). The click on the Button and wait for the alert to appear ('doCick' function is triggered). Stop the profiler.
4. See the result - repeat points 1 to 4
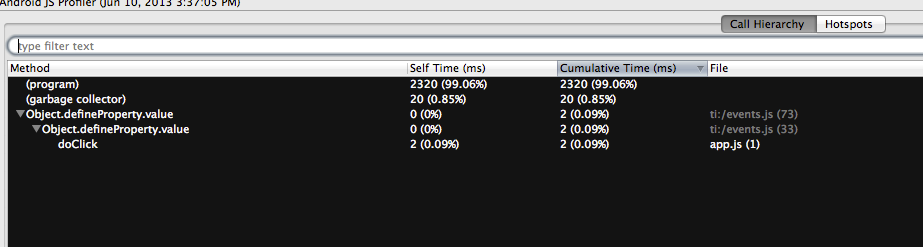
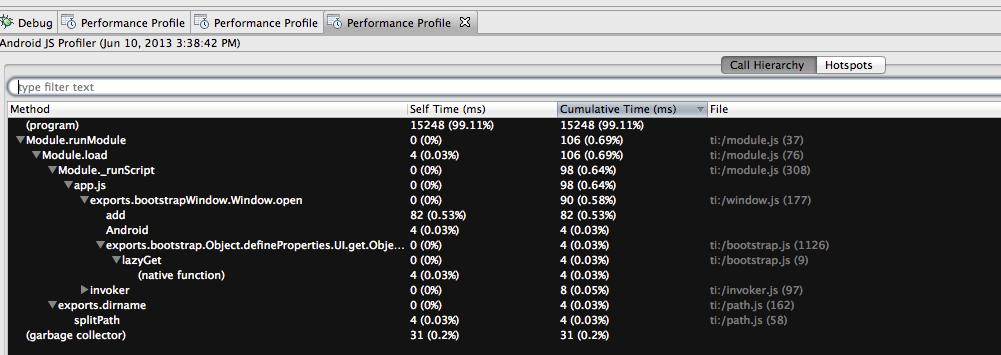
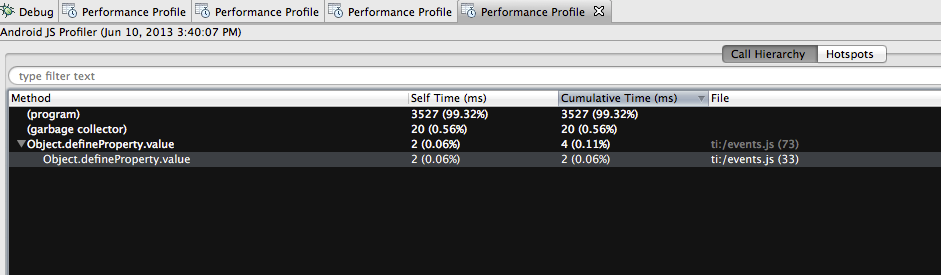
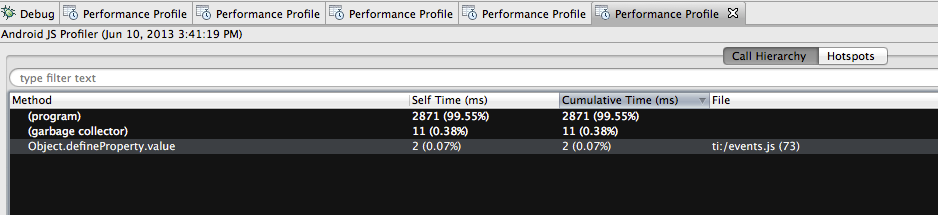
Expected result: 'Performance Profile' section is reporting details about the two name function called ('doClick' and 'showAlert') and the two unnamed functions() being called after the 'setTimer'. Output result is also consistent every time the test is performed.
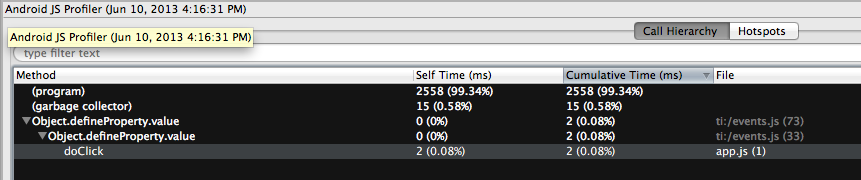
Result: outputs are inconsistent and different every time. The two functions (one called 'doClick' and the other one called 'showAlert') are not always present in the output.
Attached some of the outputs I got from my testing.
Additional notes
Not reproducible on iOS.
Downgrading to Major as the issue is with V8's snapshotting implementation, which we will likely have to revisit.
@Ingo: renamed. However, those are output screenshots taken separately, using the same code and following the same steps - i.e. the app has been rebuilt and reinstalled every time (repeating points 1 to 4 as in the description).
I think we need to set expectations on what the android profiler should do. V8 will take samples at certain intervals of the program execution to determine where the CPU spent most of this time. The interval for the sampling is around 5ms on Android devices. By taking this approach, it's not accurate to expect every single function call to show up in the profile data. The profiler is meant to track down hotspots of where the CPU spent most of its time, so a better test would be to have a function that takes a long time to run (or have it called many times). Some functions may not take up enough CPU time to show up in the profiler data. Functions with shorter execution times may show up intermittently depending on how long it took during that run and the timing of when v8 takes the samples. Here is a blog that describes this behavior: http://blog.nodetime.com/2012/05/cpu-profiling-with-nodetime.html I have created an effective test case that should return the a method name every time.
var win = Titanium.UI.createWindow({ title : 'Tab 1', backgroundColor : '#fff' }); var label1 = Titanium.UI.createLabel({ color : '#999', text : 'I am Window 1', font : { fontSize : '24dp', fontFamily : 'Helvetica Neue' }, textAlign : 'center', width : 'auto' }); win.add(label1); var button = Ti.UI.createButton({ bottom : '10', title : 'click' }); button.addEventListener('click', loopManyTimes); function loopManyTimes() { for (var i = 0; i < 10000; i++) { Ti.API.info('-------------' + i); } } win.add(button); win.add(label1); win.open();Another test case: 1. Launch the KS app 2. Go to Platform > XHR > File Download 3. Start the profiler 4. Click on Large File Download 5. Wait for it to download 10% 6. Hit stop profile Expected result: You should see ondatastream callback as one of the nodes in the profile data
Alloy code:
index.xml
   <Alloy>
       <Window>
           <Label id='label1'></Label>
           <Button onClick='loopManyTimes'>Click</Button>
       </Window>
   </Alloy>
app.tss
   "Window": {
   	backgroundColor:"blue"
   }

   "Button":{
   	bottom:10
   }

   "#label1": {
   	color : 'white',
       text : 'I am Window 1',
       font : {
           fontSize : '24dp',
           fontFamily : 'Helvetica Neue'
       },
       textAlign : 'center',
       width : 'auto'
   }
index.js
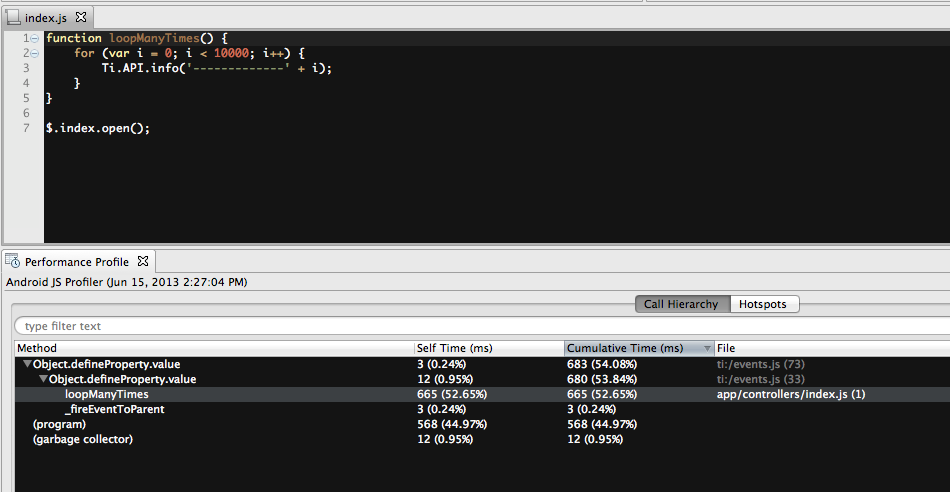
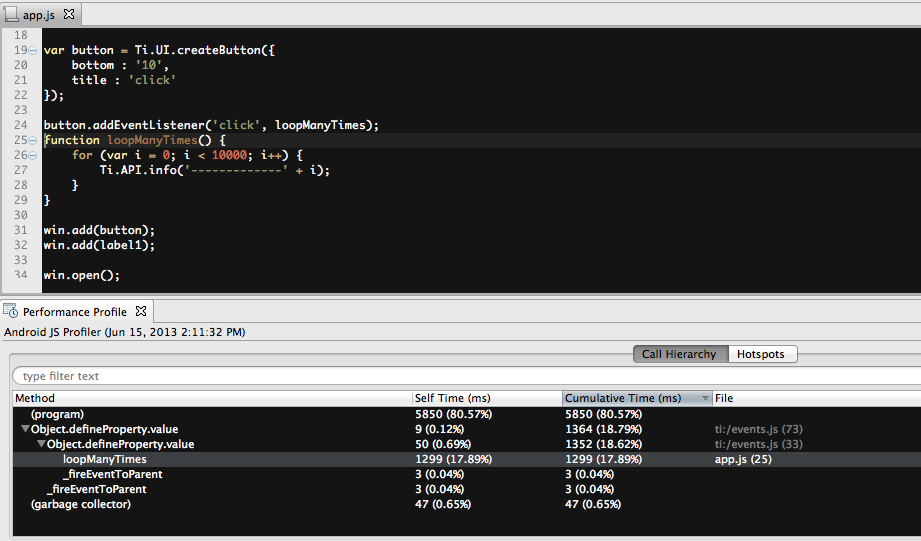
function loopManyTimes() { for (var i = 0; i < 10000; i++) { Ti.API.info('-------------' + i); } } $.index.open();Attached the screenshot of the current results on Android using Allen provided sample code (classic project) and with it's relative Alloy version. Double clicking on the 'loopManyTimes' function name in the results, opens correctly the correspective file where the function is declared (app.js for the classic project and index.js for the alloy project)
Marking as resolved for now since Federico verified the expected behavior.
Tested with classic app provided by Allen, loopManyTimes() function shows up everytime after profiler is stopped. Verified fix on: Device : Google Nexus 3, Android Version: 4.0.4, SDK: 3.2.0.v20131113183932 CLI version : 3.2.0 OS : MAC OSX 10.8.4 Alloy : 1.3.0 Appcelerator Studio, build: 3.2.0.201311122338 XCode : 5.0.2
reopened to edit the comment
closing after editing.