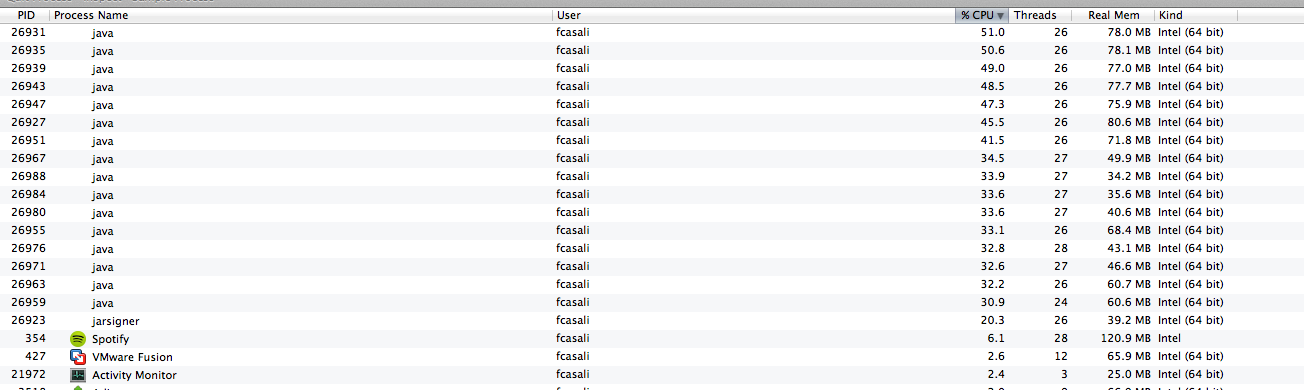
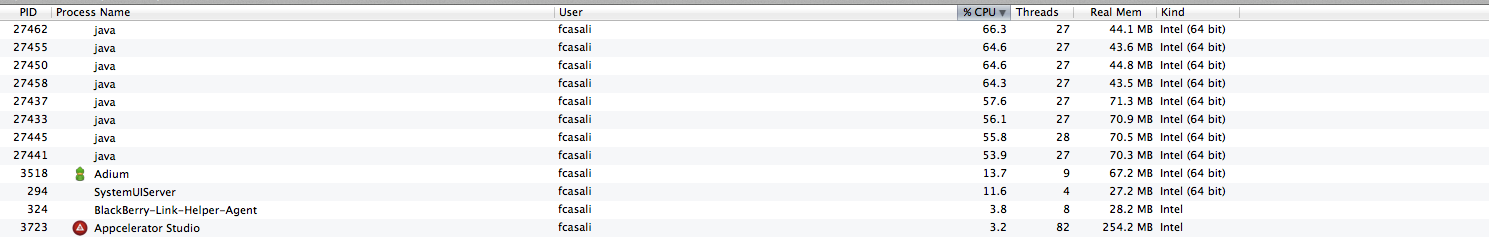
[TIMOB-14743] BlackBerry: 'java' processes belonging to 'Appcelerator Studio' might kill the CPU
| GitHub Issue | n/a |
|---|---|
| Type | Bug |
| Priority | Critical |
| Status | Closed |
| Resolution | Fixed |
| Resolution Date | 2013-08-05T20:35:06.000+0000 |
| Affected Version/s | Release 3.1.2 |
| Fix Version/s | 2013 Sprint 16, Release 3.1.2, Release 3.2.0 |
| Components | BlackBerry |
| Labels | performance, qe-3.1.2, qe-testadded |
| Reporter | Federico Casali |
| Assignee | Russell McMahon |
| Created | 2013-07-26T23:21:21.000+0000 |
| Updated | 2013-10-01T22:12:15.000+0000 |
Description
Attachments
| File | Date | Size |
|---|---|---|
| processes.png | 2013-08-01T21:11:14.000+0000 | 35114 |
| processes-commandLine.png | 2013-08-01T21:27:55.000+0000 | 32315 |
| Screen Shot 2013-07-26 at 12.52.47 PM.png | 2013-07-26T23:21:21.000+0000 | 102292 |
| Screen Shot 2013-07-26 at 12.53.42 PM.png | 2013-07-26T23:21:21.000+0000 | 65676 |
| Screen Shot 2013-07-26 at 4.11.22 PM.png | 2013-07-26T23:21:21.000+0000 | 47144 |
Both Federico and Pedro experienced the issue on Mac. It will be good to know if this happens on Windows as well.
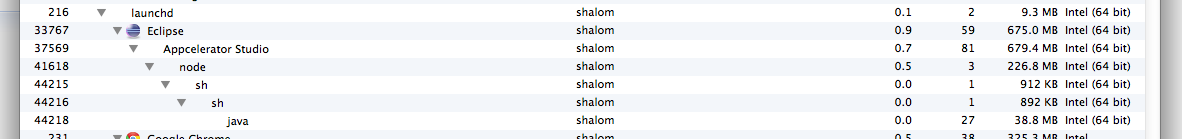
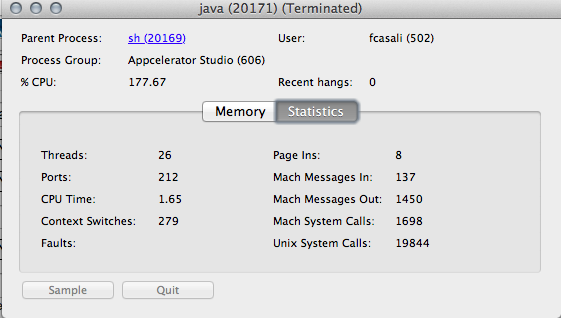
Investigated this for a while, and looks like not much can be done from the Studio side. We call for a titanium process once and from that moment the node process is spawning other processes that are out of our control. The previously attached screen shot do not show the process hierarchy of those Java processes. I've attached another "processes.png" that shows it. You will notice that a node process is spawning sh processes that eventually spawn a java process. These processes on my system were getting a new pid every second, which may mean that there is some sort of a loop in the scripts that does that. I believe that something went wrong killing those processes and they kept on adding up.
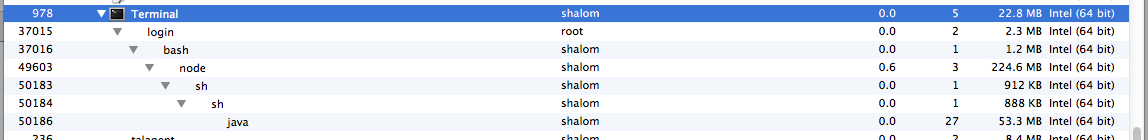
Also attaching a screenshot that shows the same behavior when launching from a command-line with the following parameters:
Hi Russ, could you or Pedro help take a look at this issue? If we look at both the process hierarchy tree or the screenshot Federico attached, the Java process belongs to the "sh" process, which comes from the node call. Running from the command line shows the similar tree. It appears there might be cases where some Java processes spawn by CLI didn't get terminated correctly and left running, causing issue with CPU and memory. Let me know if additional information is needed. Thanks.
I'll take a look. The log file is retrieved on a timer and output printed to standard out. It's probably that interaction that is causing trouble, also are you able to reproduce using just terminal? It's probably easier to fix and debug if you can create a reproducible case using just CLI and terminal.
https://github.com/appcelerator/titanium_mobile_blackberry/pull/148
Not able to reproduce the issue using the latest 3.1.2 SDK Titanium SDK 3.1.2.v20130807111603 Alloy 1.2.0-alpha6 Appcelerator Studio 3.1.2.201308021524 CLI 3.1.1 Node 0.10.13 Closing.