[TIMOB-19774] iOS Profiler: Studio Error getting the performance data snapshot
| GitHub Issue | n/a |
|---|
| Type | Bug |
|---|
| Priority | High |
|---|
| Status | Closed |
|---|
| Resolution | Fixed |
|---|
| Resolution Date | 2015-10-23T23:18:54.000+0000 |
|---|
| Affected Version/s | n/a |
|---|
| Fix Version/s | Release 5.1.0 |
|---|
| Components | iOS |
|---|
| Labels | ios, profiler, user_experience |
|---|
| Reporter | Ricardo Ramirez |
|---|
| Assignee | Chee Kiat Ng |
|---|
| Created | 2015-09-02T16:12:01.000+0000 |
|---|
| Updated | 2015-11-20T04:33:37.000+0000 |
|---|
Description
Issue Description
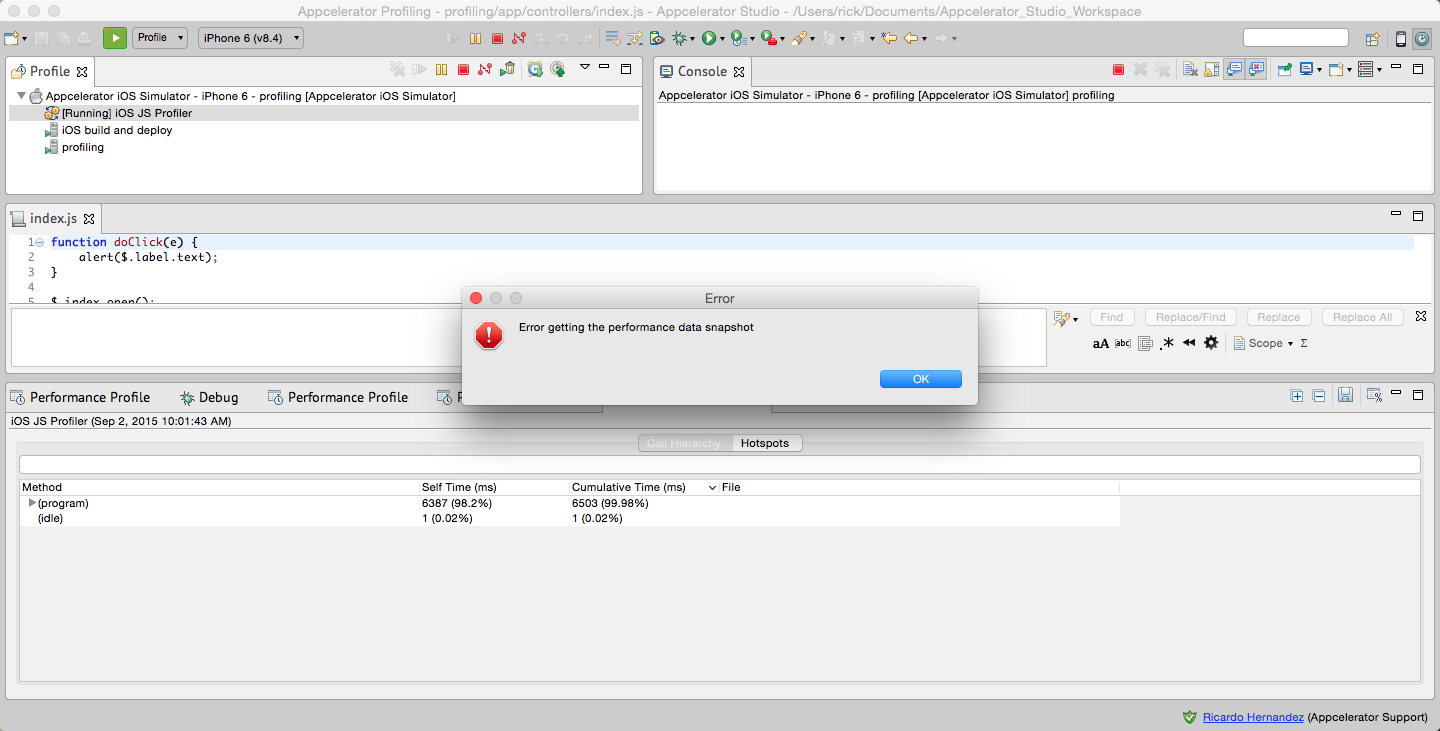
When the user click on the Capture performance profile button the alert with the message:
Error getting the performance data snapshot
and the snapshot is not captured
Expected behavior
capture a snapshot without errors
Steps to Replicate:
1. Create a new titanium alloy/classic default project
2. Run as profile on any iOS simulator
3. In the profile view click the Capture Performance Profile
4. The alert is displayed with the error
** Profile log and Ti info attached
Additional note:
This is not happening in all my projects, I also have other project where I can capture the snapshot and the Ti version is the same. In Android Works perfectly on Titanium SDK 3.5.1.GA, 4.0.0.GA, 4.1.0.GA.
Attachments
I need the Studio log file. Without that, I can't tell what is going on.
The Studio Log is attached, when the snapshot is captured, the studio just throws the alert message (As is showed in the image attached) but never print an error in the log.
[~pinnamuri] to tell them how to add logging information.
[~rramirez] The studio log points to the console output from the profile command. Would it be possible to enable Debug Level to All in Preferences > Studio > Troubleshooting, and clear/backup the logs through Help > Studio > Clear log file, and then profile the app. The studio logs should be available at Help > Studio > View log file.
[~pinnamuri] [~rramirez]
Logile Attached.
[~kkolipaka] Try with iOS 8.4 simulator. You can work with [~cng] to understand why Studio is receiving invalid hprof data after profiling.
iOS Profiler was rebuild to 64 bits previously. This in turn, changed NSUInteger into 64 bit (previously was 32 bit), causing it to return invalid results to Studio when Studio was expecting 32 bits.
profiler PR: https://github.com/appcelerator/titanium_profiler/pull/13 Master PR: https://github.com/appcelerator/titanium_mobile/pull/7337 5_1_X PR: https://github.com/appcelerator/titanium_mobile/pull/7338
Closing ticket as fixed. Verified that if I try to "Capture Performance Profile" or stop capturing performance profile, then I do not get the "Error getting the performance data snapshot". Tested on: Appcelerator Studio, build: 4.4.0.201510280736 Appc CLI NPM: 4.2.1 Appc CLI Core: 5.1.0-38 Arrow: 1.3.13 SDK: 5.1.0.v20151028143628 Node: v4.2.1 OS: El Capitan (10.11.1) Xcode: 7.1 Devices: iphone simulator (9.1), iphone 6 plus (9.1)