[TIMOB-26425] iOS: Crash in unregisterTimer with 'pointer being freed was not allocated'
| GitHub Issue | n/a |
|---|---|
| Type | Bug |
| Priority | Critical |
| Status | Resolved |
| Resolution | Fixed |
| Resolution Date | 2018-10-02T19:44:52.000+0000 |
| Affected Version/s | n/a |
| Fix Version/s | Release 7.4.1 |
| Components | n/a |
| Labels | crash, crashes, crashing, ios, mainthread, thread, threading |
| Reporter | Christy Thomas |
| Assignee | Jan Vennemann |
| Created | 2018-09-21T14:59:07.000+0000 |
| Updated | 2018-10-19T18:08:25.000+0000 |
Description
This is a critical crash that is affecting the deployment of our application. It happens frequently and it is because something is trying to clean up a timer that no longer exists.
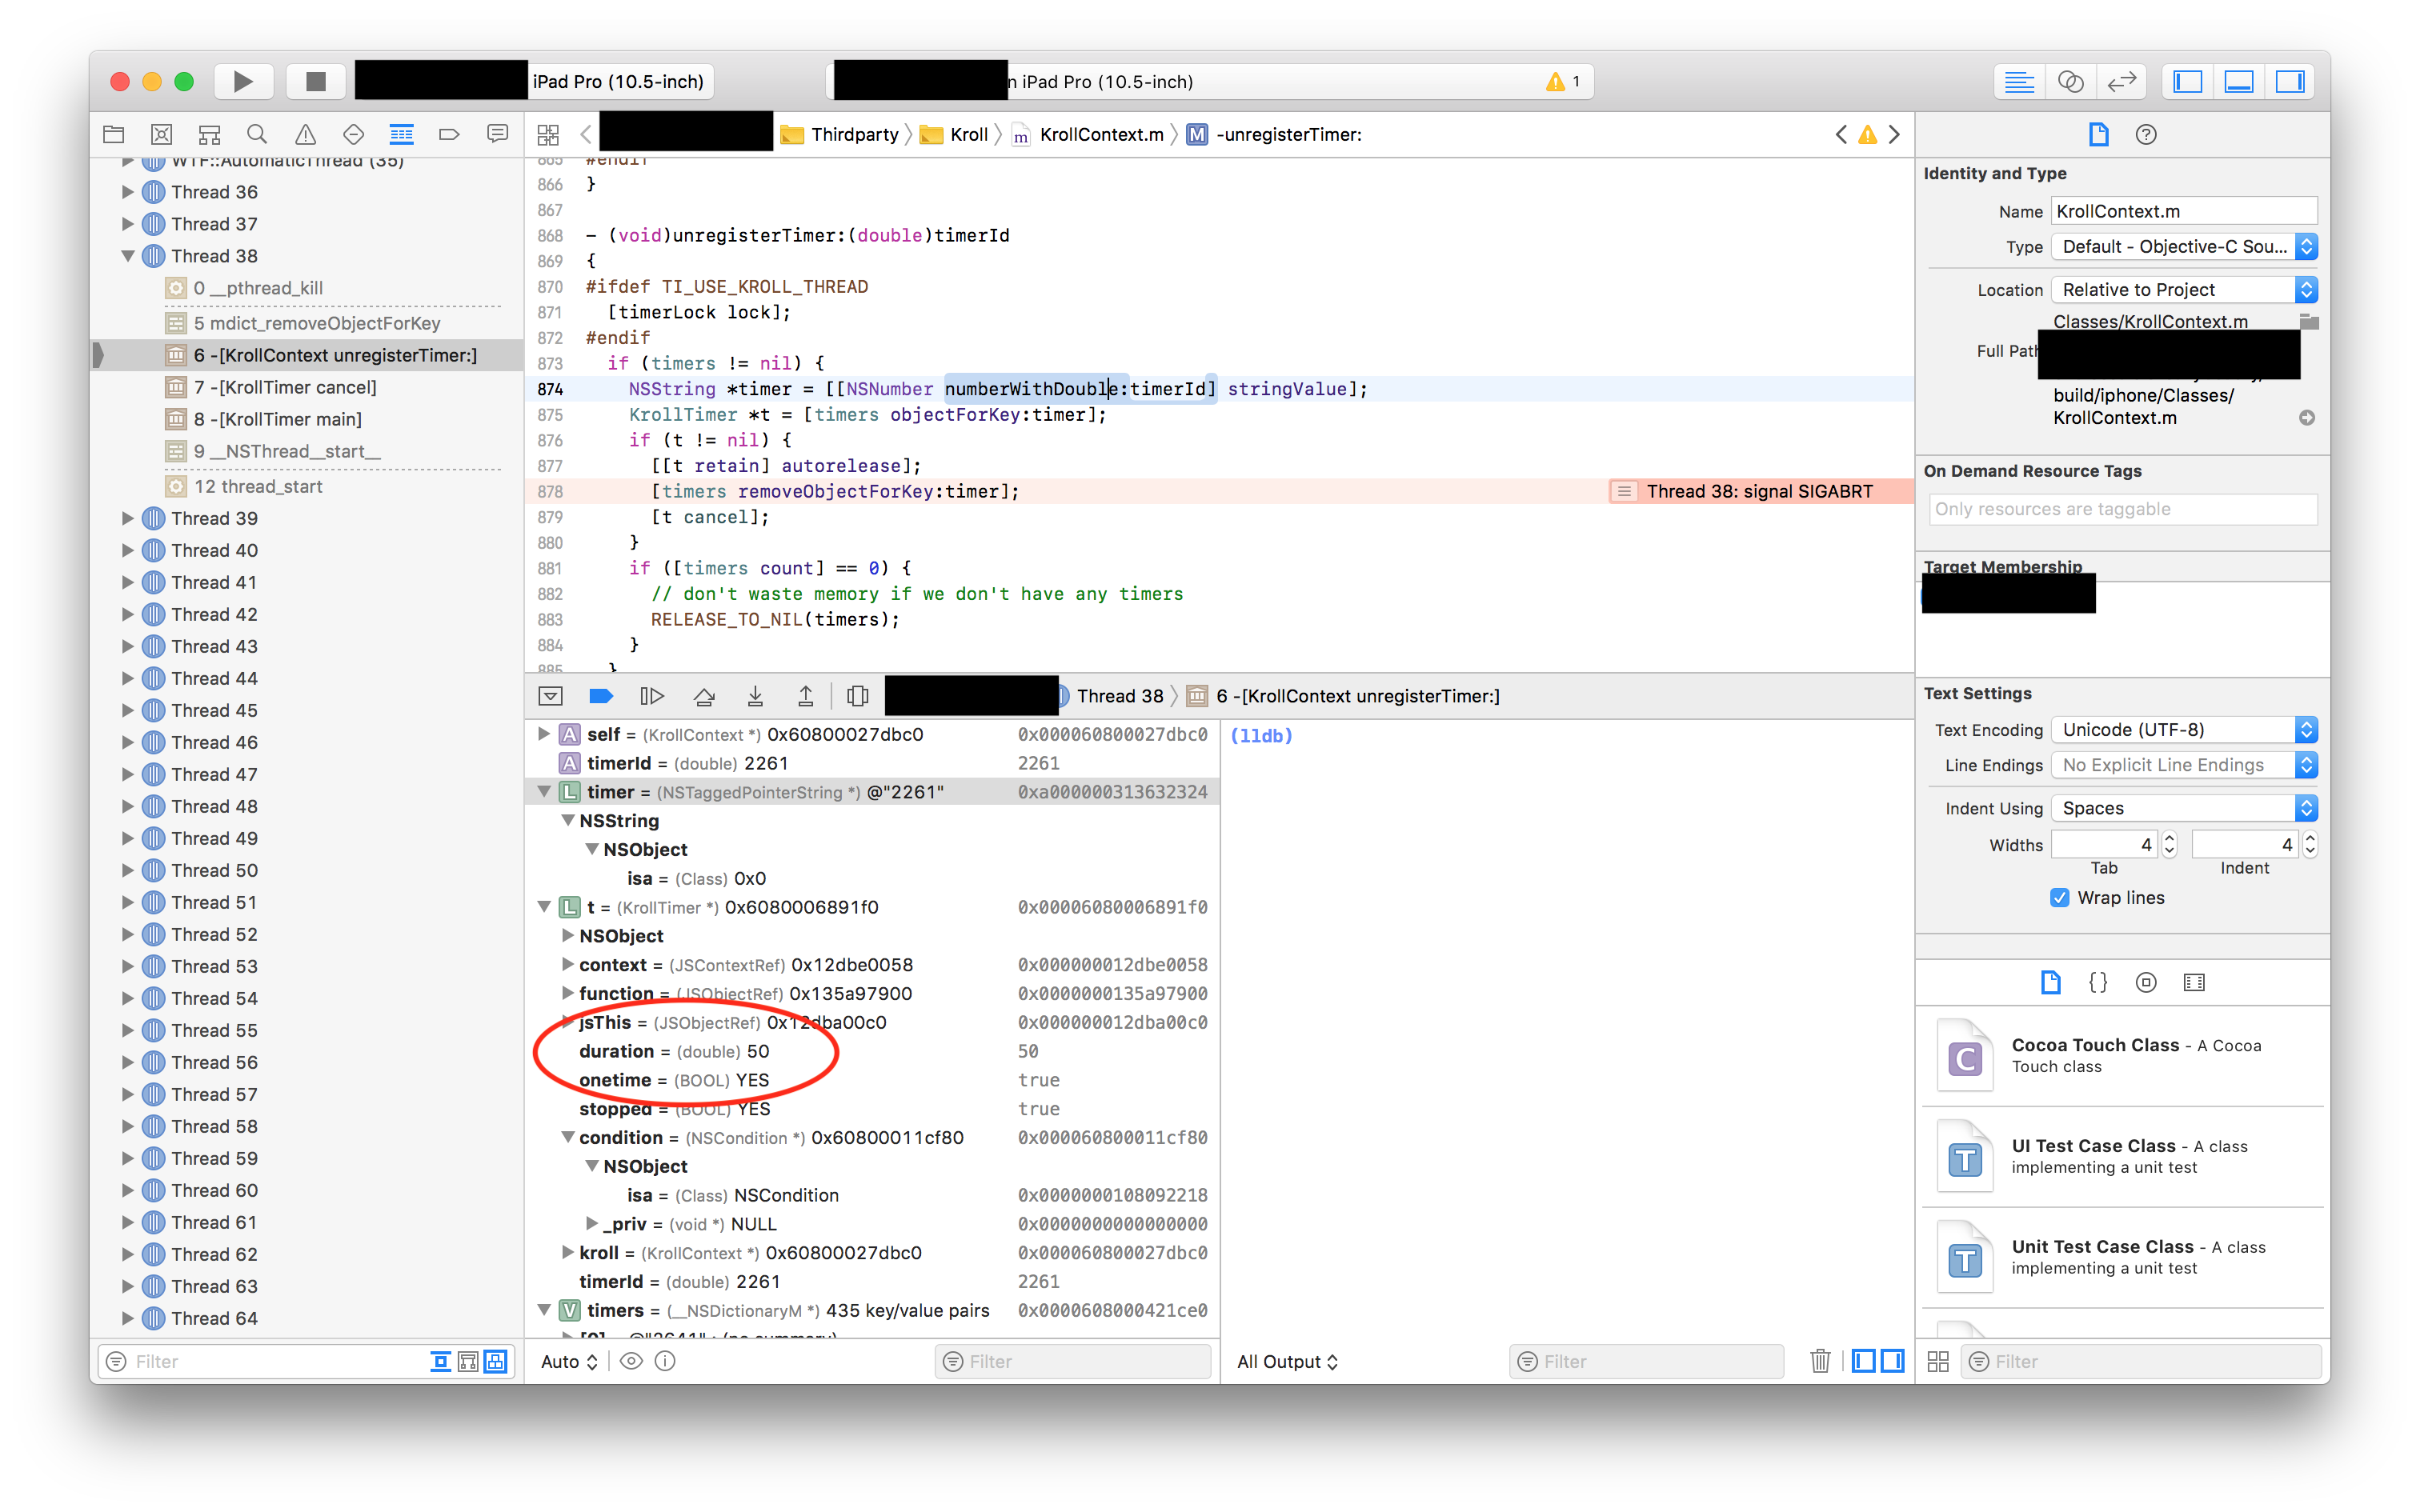
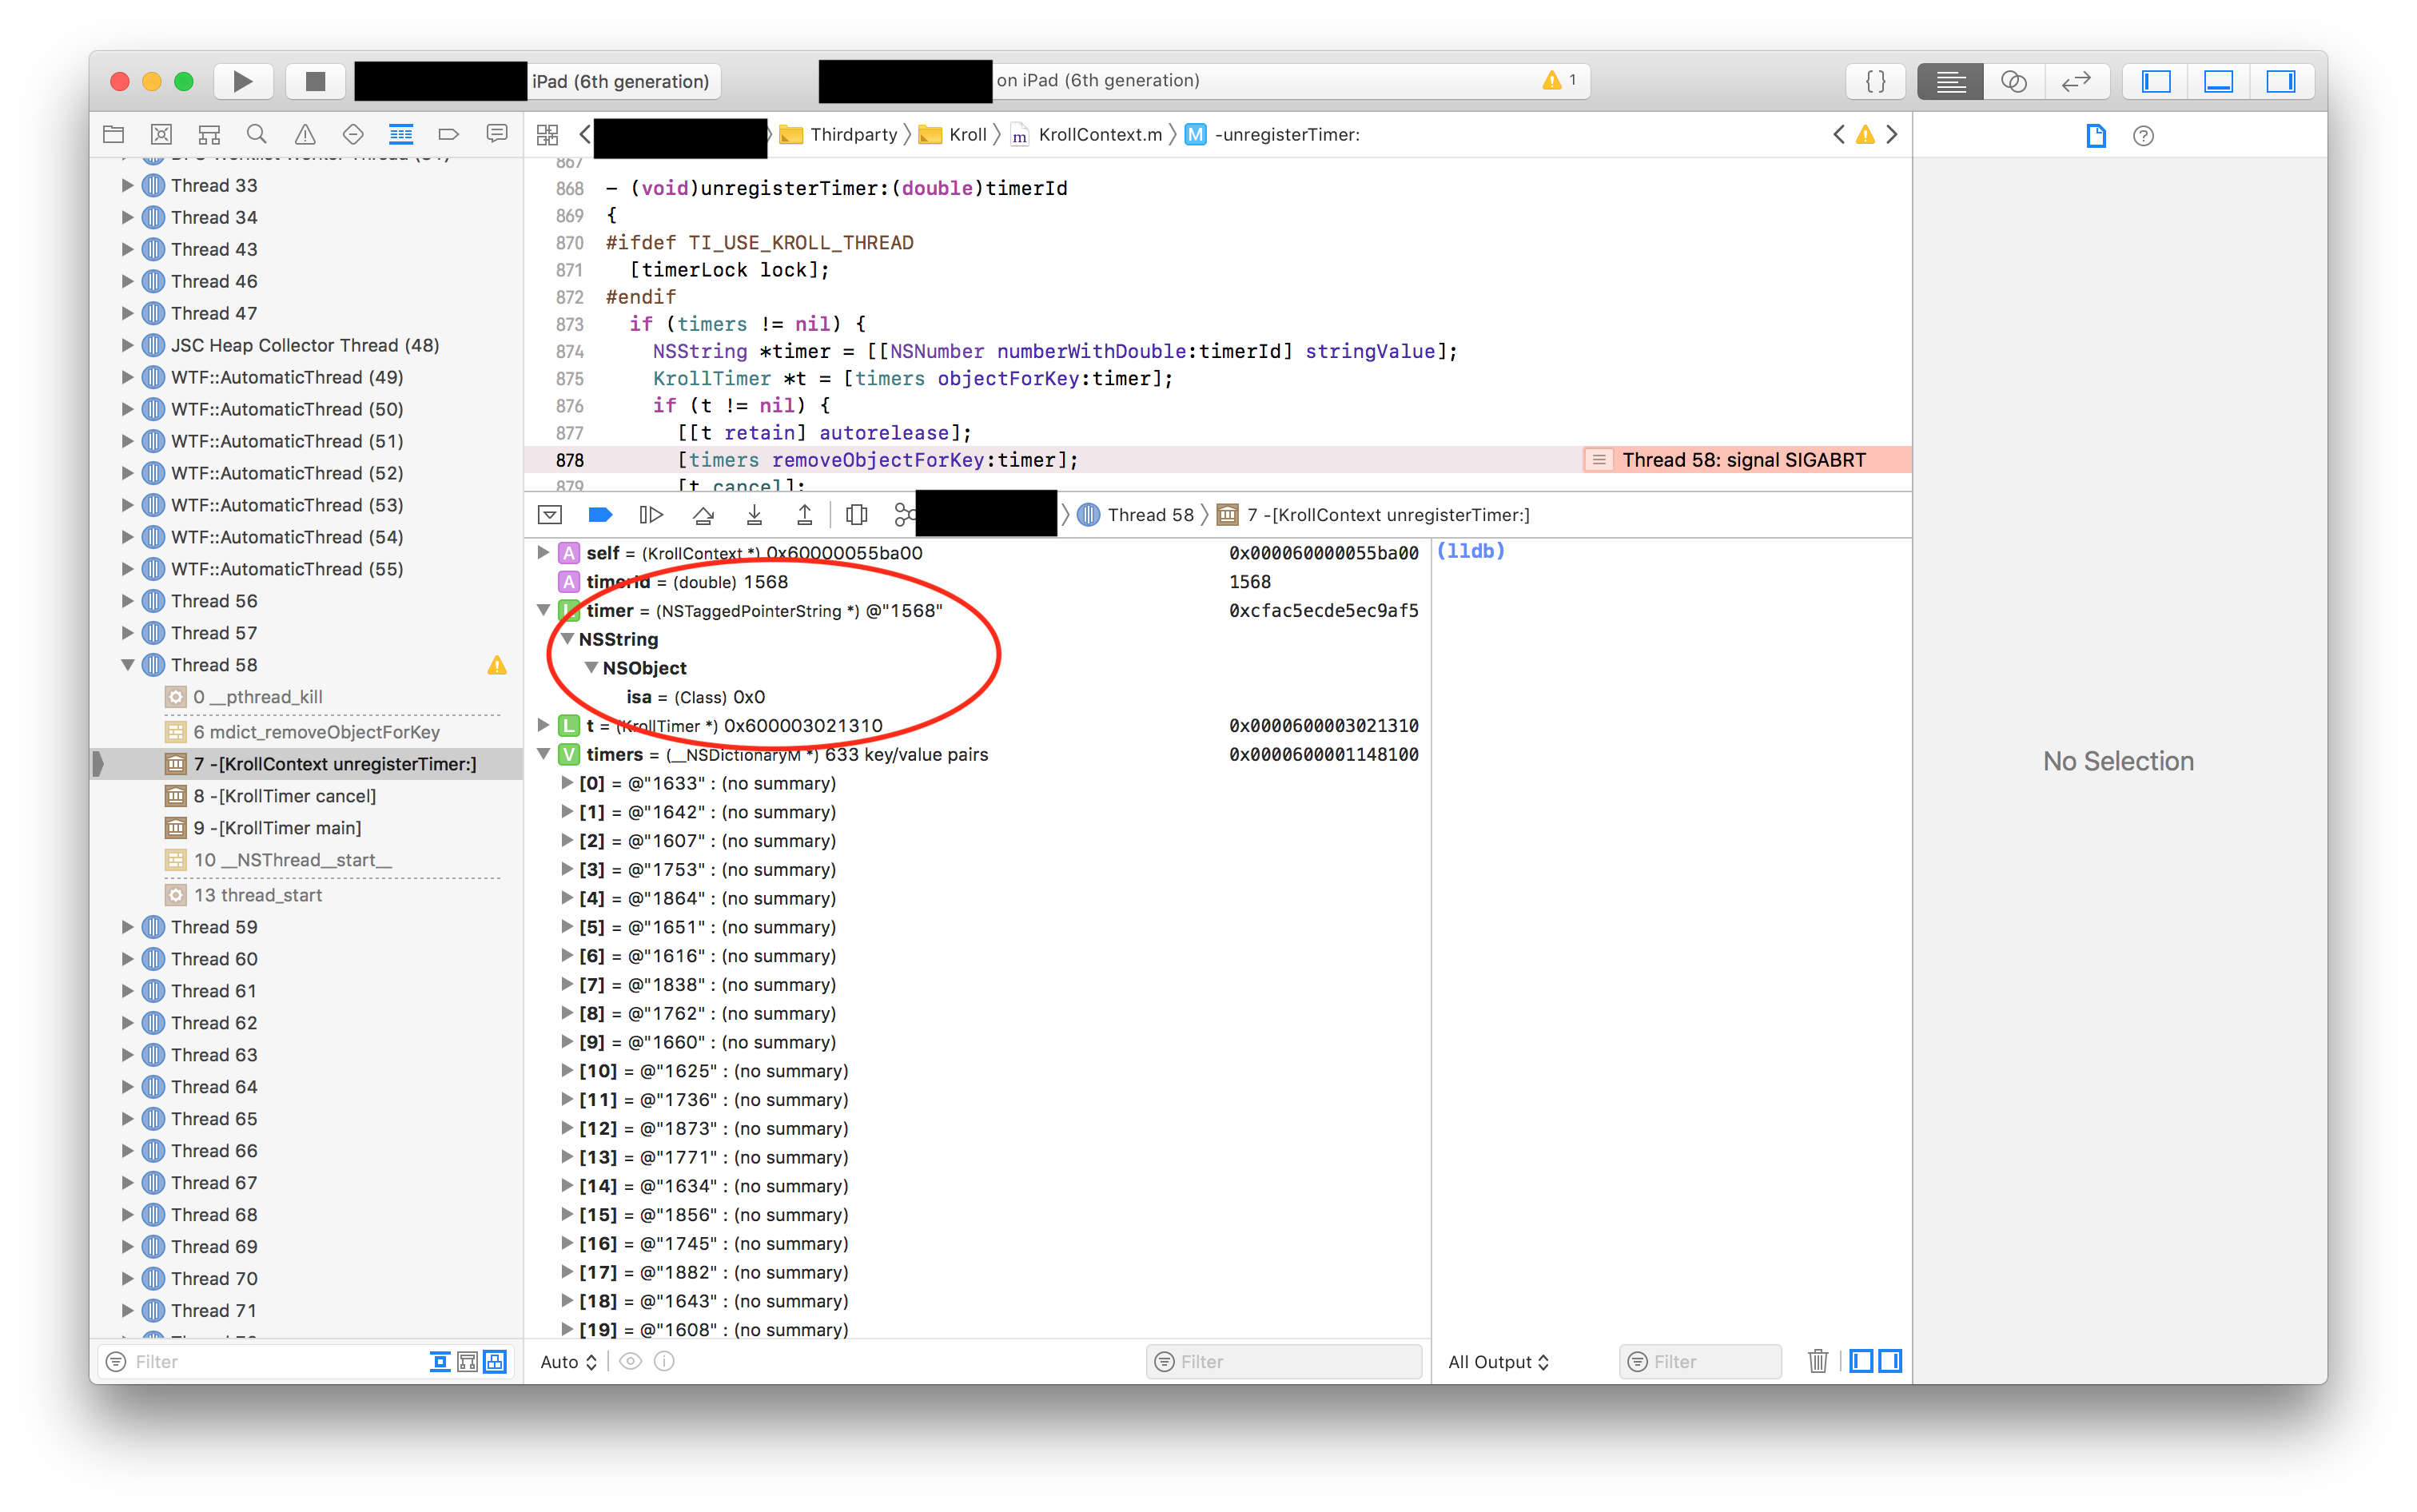
When the app crashes there are around 560-650 threads, with a similar number of timers. The majority of the timers have a duration of 50.
The timer cannot be traced back to anything in our code. Our code sets up two intervals that stick around for the lifetime of the app:
* id of 19 for duration of 15000 for server keep alive
* id of 20 for duration of 30000 for google analytics
We have another interval with a duration of 300000 that is cleared and recreated and keeps track of payment device connection.
true
Changing to false for the above seems to help with the issue. Is there a problem with run-on-main-thread being set to false? I see that in a new blank project you are setting this to true and I want to understand the issues that might arise with using false.
Exception Type:        EXC_CRASH (SIGABRT)
Exception Codes:       0x0000000000000000, 0x0000000000000000
Exception Note:        EXC_CORPSE_NOTIFY

Application Specific Information:
abort() called
*** error for object 0x7fcc402ce600: pointer being freed was not allocated

CoreSimulator 518.22 - Device: iPad Air 2 - Runtime: iOS 11.4 (15F79) - DeviceType: iPad Air 2

Thread 26 Crashed:
0   libsystem_kernel.dylib        	0x000000011793eb66 __pthread_kill + 10
1   libsystem_pthread.dylib       	0x0000000117978080 pthread_kill + 333
2   libsystem_c.dylib             	0x0000000117599c97 abort + 127
3   libsystem_malloc.dylib        	0x00000001176d54da free + 521
4   com.apple.CoreFoundation      	0x00000001163e906b mdict_rehashd + 315
5   com.apple.CoreFoundation      	0x00000001163e7285 mdict_removeObjectForKey + 469
6   com.*************.ea            	0x000000010c793420 -[KrollContext unregisterTimer:] + 240 (KrollContext.m:879)
7   com.*************.ea            	0x000000010c7a1e83 -[KrollTimer cancel] + 195 (KrollTimer.m:59)
8   com.*************.ea            	0x000000010c7a239a -[KrollTimer main] + 890 (KrollTimer.m:138)
9   com.apple.Foundation          	0x000000010f6803b3 __NSThread__start__ + 1221
10  libsystem_pthread.dylib       	0x0000000117975661 _pthread_body + 340
11  libsystem_pthread.dylib       	0x000000011797550d _pthread_start + 377
12  libsystem_pthread.dylib       	0x0000000117974bf9 thread_start + 13
Thread 17:
0   libsystem_kernel.dylib        	0x000000011793ea16 __psynch_cvwait + 10
1   libsystem_pthread.dylib       	0x00000001179765c2 _pthread_cond_wait + 789
2   com.apple.Foundation          	0x000000010f6c5771 -[NSCondition waitUntilDate:] + 143
3   com.*************.ea            	0x000000010c7a2138 -[KrollTimer main] + 280
4   com.apple.Foundation          	0x000000010f6803b3 __NSThread__start__ + 1221
5   libsystem_pthread.dylib       	0x0000000117975661 _pthread_body + 340
6   libsystem_pthread.dylib       	0x000000011797550d _pthread_start + 377
7   libsystem_pthread.dylib       	0x0000000117974bf9 thread_start + 13
Attachments
| File | Date | Size |
|---|---|---|
| Archive.zip | 2018-10-01T12:44:34.000+0000 | 402631 |
| Screen Shot 2018-09-17 at 11.58.04 AM.png | 2018-09-21T13:36:44.000+0000 | 886522 |
| Screen Shot 2018-09-18 at 12.50.03 PM.png | 2018-09-21T13:36:44.000+0000 | 777725 |
The crash does go away with
This is still a critical issue for us. Swapping to using false for run-on-main-thread is not an option. because of the performance implications in the app.
Hey [~cthomas]! We are currently investigating this issue via TIMOB-26391 and will keep you updated asap!
Unfortunately I cannot see TIMOB-26296: "This issue can't be viewed The issue you're trying to view can't be displayed. It may have been deleted or you don't have permission to view it right now." Can you please provide updates in this ticket or let us see TIMOB-26296?
Sorry, I meant TIMOB-26391!
This is still a problem after TIMOB-26391. Using the 7.4.1.v20180927102822 SDK version.
The stack trace for this one looks different than the random crashes from TIMOB-26391. Reopening for further investigation.
[~cthomas] Can you isolate a smaller test case to reproduce this issue so that we can investigate it. Thanks!
[^Archive.zip] Is an archive of the crash logs for this issue. I don't know if I can isolate to a smaller test case, because I don't know what is causing the problem. It does not have a specific reproduction scenario, but it does happen frequently while using the app. If I knew what 50 duration timer was causing the problem I might be able to isolate. It is not any of our timers in our code. Any ideas what is causing all those timer threads?
[~cthomas], for every timer you use in JS a new thread will be created so waiting for the timer to trigger will not block the UI thread. Do you actually have that many timers active in your app? Anyway, since you mentioned that disabling run-on-main-thread fixes the problem on your side we investigated and found out that a required lock for the timer threads was indeed missing. The crash seems to only occur with a lot of timers and we couldn't reproduce it with a simple test case. Please download the following SDK and test it with your app to verify the fix: https://www.dropbox.com/s/h1clg4pi3bk2g7m/mobilesdk-7.4.1.v20181002110641-osx.zip?dl=0 PR (master): https://github.com/appcelerator/titanium_mobile/pull/10360 PR (7_4_X): https://github.com/appcelerator/titanium_mobile/pull/10362
I am trying out the changes, but I did want to mention that the description of this bug has the timers that we use in our app (2 intervals and a recreated one). We don't have any that have a duration of 50. Why would so many timers/threads be sticking around with that low of a duration?
I was able to get a crash testing with 7.4.1.v20181002110641 when building an ipa file and deploying on an iPad iOS 11.4 version. I was unable to see crashes when simulating on iOS12. I am going to try this on an iOS 12 iPad. Here is a snippet from the crash log, which I can't seem to attached to this bug.
Exception Type: EXC_BREAKPOINT (SIGTRAP) Exception Codes: 0x0000000000000001, 0x000000018a36e8a0 Termination Signal: Trace/BPT trap: 5 Termination Reason: Namespace SIGNAL, Code 0x5 Terminating Process: exc handler [0] Triggered by Thread: 15 Filtered syslog: None found Thread 15 Crashed: 0 JavaScriptCore 0x000000018a36e8a0 JSC::JSLockHolder::~JSLockHolder+ 39072 () + 332 1 JavaScriptCore 0x000000018a3d1b5c JSValueUnprotect + 104 2 JavaScriptCore 0x000000018a3d1b5c JSValueUnprotect + 104 3 Sally 360 0x000000010123c868 -[KrollTimer main] + 116840 (KrollTimer.m:133) 4 Foundation 0x0000000184239efc __NSThread__start__ + 1040 5 libsystem_pthread.dylib 0x0000000183415220 _pthread_body + 272 6 libsystem_pthread.dylib 0x0000000183415110 _pthread_body + 0 7 libsystem_pthread.dylib 0x0000000183413b10 thread_start + 4On iOS 12 version I see a bit different crash log: Only 37 total threads at the time of crash.
Exception Type: EXC_CRASH (SIGKILL) Exception Codes: 0x0000000000000000, 0x0000000000000000 Exception Note: EXC_CORPSE_NOTIFY Termination Reason: Namespace SPRINGBOARD, Code 0x8badf00d Termination Description: SPRINGBOARD, scene-update watchdog transgression: com.demandware.endlessaisle exhausted real (wall clock) time allowance of 10.00 seconds | ProcessVisibility: Foreground | ProcessState: Running | WatchdogEvent: scene-update | WatchdogVisibility: Foreground | WatchdogCPUStatistics: ( | "Elapsed total CPU time (seconds): 95.010 (user 95.010, system 0.000), 30% CPU", | "Elapsed application CPU time (seconds): 23.473, 7% CPU" | ) Triggered by Thread: 0 Thread 0 name: Dispatch queue: com.apple.main-thread Thread 0 Crashed: 0 libsystem_kernel.dylib 0x00000001b89cbf0c __psynch_cvwait + 8 1 libsystem_pthread.dylib 0x00000001b8a48d48 _pthread_cond_wait$VARIANT$mp + 636 2 JavaScriptCore 0x00000001c011cef0 WTF::ThreadCondition::timedWait+ 302832 (WTF::Mutex&, WTF::WallTime) + 80 3 JavaScriptCore 0x00000001c01040f4 WTF::ParkingLot::parkConditionallyImpl(void const*, WTF::ScopedLambda<bool ()> const&, WTF::ScopedLambda<void + 200948 ()> const&, WTF::TimeWithDynamicClockType const&) + 2004 4 JavaScriptCore 0x00000001c00f9538 WTF::LockAlgorithm<unsigned char, (unsigned char)1, (unsigned char)2, WTF::EmptyLockHooks<unsigned char> >::lockSlow+ 156984 (WTF::Atomic<unsigned char>&) + 320 5 JavaScriptCore 0x00000001c0a1bc8c JSC::JSLock::lock+ 9735308 (long) + 172 6 JavaScriptCore 0x00000001c0a1b914 JSC::JSLockHolder::JSLockHolder+ 9734420 (JSC::VM&) + 52 7 JavaScriptCore 0x00000001c0169050 JSObjectGetProperty + 68 8 Sally 360 0x0000000100ee7490 __65-[KrollObject invokeCallbackForKey:withObject:thisObject:onDone:]_block_invoke + 111760 (KrollObject.m:1081) 9 libdispatch.dylib 0x00000001b886e6c8 _dispatch_call_block_and_release + 24 10 libdispatch.dylib 0x00000001b886f484 _dispatch_client_callout + 16 11 libdispatch.dylib 0x00000001b881b9ec _dispatch_main_queue_callback_4CF$VARIANT$mp + 1068 12 CoreFoundation 0x00000001b8dc51bc __CFRUNLOOP_IS_SERVICING_THE_MAIN_DISPATCH_QUEUE__ + 12 13 CoreFoundation 0x00000001b8dc0084 __CFRunLoopRun + 1964 14 CoreFoundation 0x00000001b8dbf5b8 CFRunLoopRunSpecific + 436 15 GraphicsServices 0x00000001bb033584 GSEventRunModal + 100 16 UIKitCore 0x00000001e53ff558 UIApplicationMain + 212 17 Sally 360 0x0000000100ed3ec8 main + 32456 (main.m:30) 18 libdyld.dylib 0x00000001b887fb94 start + 4Can you test again with the latest changes to 7.4.1? You can download it from https://www.dropbox.com/s/tnj6om696g4llf2/mobilesdk-7.4.1.v20181004162821-osx.zip?dl=0 If you want you can also send me a copy of your project so we can internally use it for testing and further evaluation to [mailto:jvennemann@axway.com], thanks!
I tried the 7.4.1.v20181004162821 SDK and I saw an app freeze this time and then it did crash. I haven't seen a freeze like that before. So I think the newer version is worse.
Exception Type: EXC_CRASH (SIGKILL) Exception Codes: 0x0000000000000000, 0x0000000000000000 Exception Note: EXC_CORPSE_NOTIFY Termination Reason: Namespace SPRINGBOARD, Code 0x8badf00d Termination Description: SPRINGBOARD, scene-update watchdog transgression: com.demandware.endlessaisle exhausted real (wall clock) time allowance of 10.00 seconds | ProcessVisibility: Foreground | ProcessState: Running | WatchdogEvent: scene-update | WatchdogVisibility: Foreground | WatchdogCPUStatistics: ( | "Elapsed total CPU time (seconds): 404.020 (user 404.020, system 0.000), 25% CPU", | "Elapsed application CPU time (seconds): 52.428, 3% CPU" | ) Triggered by Thread: 0 Thread 0 name: Dispatch queue: com.apple.main-thread Thread 0 Crashed: 0 libsystem_kernel.dylib 0x00000001ac4e3f0c __psynch_cvwait + 8 1 libsystem_pthread.dylib 0x00000001ac560d48 _pthread_cond_wait$VARIANT$mp + 636 2 JavaScriptCore 0x00000001b3c34ef0 WTF::ThreadCondition::timedWait+ 302832 (WTF::Mutex&, WTF::WallTime) + 80 3 JavaScriptCore 0x00000001b3c1c0f4 WTF::ParkingLot::parkConditionallyImpl(void const*, WTF::ScopedLambda<bool ()> const&, WTF::ScopedLambda<void + 200948 ()> const&, WTF::TimeWithDynamicClockType const&) + 2004 4 JavaScriptCore 0x00000001b3c114c0 WTF::LockAlgorithm<unsigned char, (unsigned char)1, (unsigned char)2, WTF::EmptyLockHooks<unsigned char> >::lockSlow+ 156864 (WTF::Atomic<unsigned char>&) + 200 5 JavaScriptCore 0x00000001b4533c8c JSC::JSLock::lock+ 9735308 (long) + 172 6 JavaScriptCore 0x00000001b4533914 JSC::JSLockHolder::JSLockHolder+ 9734420 (JSC::VM&) + 52 7 JavaScriptCore 0x00000001b3c82164 JSObjectCallAsFunction + 80 8 Sally 360 0x0000000100bb8440 -[KrollTimer invokeWithCondition:] + 115776 (KrollTimer.m:66) 9 Sally 360 0x0000000100bafd4c -[KrollInvocation invoke:] + 81228 (KrollContext.m:105) 10 Sally 360 0x0000000100bb0c5c -[KrollContext invoke:] + 85084 (KrollContext.m:0) 11 libdispatch.dylib 0x00000001ac3866c8 _dispatch_call_block_and_release + 24 12 libdispatch.dylib 0x00000001ac387484 _dispatch_client_callout + 16 13 libdispatch.dylib 0x00000001ac3339ec _dispatch_main_queue_callback_4CF$VARIANT$mp + 1068 14 CoreFoundation 0x00000001ac8dd1bc __CFRUNLOOP_IS_SERVICING_THE_MAIN_DISPATCH_QUEUE__ + 12 15 CoreFoundation 0x00000001ac8d8084 __CFRunLoopRun + 1964 16 CoreFoundation 0x00000001ac8d75b8 CFRunLoopRunSpecific + 436 17 GraphicsServices 0x00000001aeb4b584 GSEventRunModal + 100 18 UIKitCore 0x00000001d8f17558 UIApplicationMain + 212 19 Sally 360 0x0000000100ba3cc8 main + 31944 (main.m:30) 20 libdyld.dylib 0x00000001ac397b94 start + 4I am finding out about providing the project to you.
@Christy If your app uses setInterval or setTimer, (and if you think this is the issue) you might want to try my forked update of
ti.mely, a native timers replacement module. My apps have been running ok with them for tests running over 24 hours. (Note the slightly different syntax required, since you need to create the proxied timer object first. be sure to see the example app.js) [https://github.com/kosso/ti.mely](https://github.com/kosso/ti.mely) Might be worth a shot ;) Also, a quick google for "parkConditionallyImpl" shows some issues related to webkit and thread deadlocks.I am not able to provide our project, but I have been trying to create a small reproduction case without all of our code and I have been unsuccessful. I have an app with what I think may be the issue with the intervals, but I haven't seen a crash. I find it interesting that some things work in our app, but don't work in the new 7.4.0 app I created. For instance we have: var customDialog = Alloy.createController(...); customDialog.once(event, function); And this is causing an issue with the new project, but not the old. Makes me wonder how our old projects is working and if it is really using the latest SDK or not. To get it to work I had to use customDialog.on() instead. How is our old app working? I'm trying to get the two apps as close as possible without providing all the code.
This issue is marked as Resolved and we are still experiencing problems. 7.4.1.v20181002110641 is more reliable compared to 7.4.1.v20181004162821, but both of them still cause crashes in our app.
[~cthomas], by default Alloy uses an old version of backbone (0.9.2) for compatibility with older projects which only has
onandoff. You probably switched to a newer version of backbone in your other project which has support foronce(see https://docs.appcelerator.com/platform/latest/#!/guide/Alloy_Backbone_Migration). A few questions to your app behavior in 7.4.1: Do you still see other timer threads than the ones you create yourself when you run your project in Xcode? Is the thread that is now crashing one of your timer threads? Can you give us a list of modules, plugins and node modules you use? Can you give us excerpts of your timer handling? That would allow us to do some more investigation until we have a reliable reproduction test case for this issue. Thanks!Yes it's the newer backbone. Thanks for the information on that as I had forgotten. I no longer see the other timer threads, so I do think this issue was resolved. This hang issue is only happening when on the iPad with iOS 12 (installed via ipa file). I am unable to connect to it with Xcode to see what is going on. It does seem to be a new issue with the hanging and may be more related to TIMOB-26391 or something with iOS 12 as the problem doesn't happen on iOS 11 with the same build. I do not have jscore in my tiapp.xml file, so we are using the default. Here are the modules and plugins:
[~cthomas], thanks for the additional info. We still suspect it's causes by timers which are causing a deadlock. Your colleague Holger send us various crash reports and log output from our debug build indicating this. Would you mind testing with the timers module [~kosso] mentioned in his comment? If that solves the issues we can safely assume it's due the timers and maybe integrate his work into our core.