[ALOY-1606] Android: Debugger not hitting breakpoints on Windows
| GitHub Issue | n/a |
|---|---|
| Type | Bug |
| Priority | High |
| Status | Closed |
| Resolution | Fixed |
| Resolution Date | 2018-03-29T15:35:06.000+0000 |
| Affected Version/s | n/a |
| Fix Version/s | CLI Release 7.0.3 |
| Components | n/a |
| Labels | n/a |
| Reporter | Samir Mohammed |
| Assignee | Feon Sua Xin Miao |
| Created | 2017-12-18T20:18:03.000+0000 |
| Updated | 2018-05-02T10:23:10.000+0000 |
Description
Breakpoints are not being hit when using the debugger and when trying to debug to device the following error is shown:
[WARN] :   TiApplication: (main) [57,57] Registering module with name already in use.
[WARN] :   JSDebugger: (main) [20,77] Debugger listening on ws://127.0.0.1:56603/07e088ff-53f1-476c-a9a2-58a8cd6016b0
[WARN] :   JSDebugger: (main) [0,77] To connect Chrome DevTools, open Chrome to chrome-devtools://devtools/bundled/inspector.html?experiments=true&v8only=true&ws=127.0.0.1:56603/07e088ff-53f1-476c-a9a2-58a8cd6016b0
[WARN] :   JSDebugger: (main) [0,77] Waiting for debugger to connect for next 60 seconds...
[ERROR] :  JSDebugger: (WebsocketSelector1939) [2,79] Error with websocket server
[ERROR] :  JSDebugger: java.net.BindException: Address already in use
[ERROR] :  JSDebugger:     at sun.nio.ch.Net.bind0(Native Method)
[ERROR] :  JSDebugger:     at sun.nio.ch.Net.bind(Net.java:442)
[ERROR] :  JSDebugger:     at sun.nio.ch.Net.bind(Net.java:434)
[ERROR] :  JSDebugger:     at sun.nio.ch.ServerSocketChannelImpl.bind(ServerSocketChannelImpl.java:224)
[ERROR] :  JSDebugger:     at sun.nio.ch.ServerSocketAdaptor.bind(ServerSocketAdaptor.java:74)
[ERROR] :  JSDebugger:     at sun.nio.ch.ServerSocketAdaptor.bind(ServerSocketAdaptor.java:67)
[ERROR] :  JSDebugger:     at org.java_websocket.server.WebSocketServer.run(WebSocketServer.java:296)
[ERROR] :  JSDebugger:     at java.lang.Thread.run(Thread.java:764)
app/controllers/app.js
+ Set breakpoints on line 2 and 5
+ Press the debug button from the selection menu
+ Run the program to an emulator
+ When program launches breakpoints are not hit and user is able to click "Hello world" without the break point getting hit
+ Now debug the application for a device
+ Studio shows the above error
*Expected result:*
Debugger should be able to hit breakpoints and no error should be shown when debugging to device
Attachments
| File | Date | Size |
|---|---|---|
| index.js | 2017-12-19T13:05:45.000+0000 | 63 |
| index.js | 2017-12-19T13:04:05.000+0000 | 1398 |
| Screen Shot 2017-12-19 at 2.40.39 PM.png | 2017-12-19T06:56:41.000+0000 | 1824151 |
| Screen Shot 2017-12-19 at 2.42.51 PM.png | 2017-12-19T06:56:56.000+0000 | 431514 |
When I disabled SOASTA I no longer received the above error on the Android device however breakpoints were still not getting hit.
[~smohammed] I got the error with an application that did not have soasta {noformat} -- Start application log ----------------------------------------------------- [INFO] : TiApplication: (main) [0,0] checkpoint, app created. [INFO] : TiApplication: (main) [31,31] Titanium 7.0.1 (2017/12/18 09:41 undefined) [INFO] : MultiDex: VM with version 2.1.0 has multidex support [INFO] : MultiDex: install [INFO] : MultiDex: VM has multidex support, MultiDex support library is disabled. [INFO] : Project built successfully in 39s 978ms [WARN] : TiAndroid: (main) [1004,1035] Application instance no longer available. Unable to get current activity. [WARN] : TiAndroid: (main) [1,1036] Application instance no longer available. Unable to get current activity. [WARN] : TiAndroid: (main) [0,1036] Application instance no longer available. Unable to get current activity. [WARN] : JSDebugger: (main) [30,1066] Debugger listening on ws://127.0.0.1:62092/107384af-9e3b-4a84-9661-ef847f8e4e26 [WARN] : JSDebugger: (main) [0,1066] To connect Chrome DevTools, open Chrome to chrome-devtools://devtools/bundled/inspector.html?experiments=true&v8only=true&ws=127.0.0.1:62092/107384af-9e3b-4a84-9661-ef847f8e4e26 [WARN] : JSDebugger: (main) [0,1066] Waiting for debugger to connect for next 60 seconds... [WARN] : JSDebugger: (WebSocketWorker-19368) [303,1369] Debugger client connected [INFO] : TiApplication: (main) [113,1482] Titanium Javascript runtime: v8 [INFO] : TiRootActivity: (main) [0,0] checkpoint, on root activity create, savedInstanceState: null [WARN] : TiApplication: (main) [62,62] Registering module with name already in use. [WARN] : JSDebugger: (main) [16,78] Debugger listening on ws://127.0.0.1:62092/56a6f667-673a-4ee8-bb72-9baa6e56470e [WARN] : JSDebugger: (main) [1,79] To connect Chrome DevTools, open Chrome to chrome-devtools://devtools/bundled/inspector.html?experiments=true&v8only=true&ws=127.0.0.1:62092/56a6f667-673a-4ee8-bb72-9baa6e56470e [WARN] : JSDebugger: (main) [0,79] Waiting for debugger to connect for next 60 seconds... [ERROR] : JSDebugger: (WebsocketSelector19392) [0,79] Error with websocket server [ERROR] : JSDebugger: java.net.BindException: Address already in use [ERROR] : JSDebugger: at sun.nio.ch.Net.bind0(Native Method) [ERROR] : JSDebugger: at sun.nio.ch.Net.bind(Net.java:442) [ERROR] : JSDebugger: at sun.nio.ch.Net.bind(Net.java:434) [ERROR] : JSDebugger: at sun.nio.ch.ServerSocketChannelImpl.bind(ServerSocketChannelImpl.java:224) [ERROR] : JSDebugger: at sun.nio.ch.ServerSocketAdaptor.bind(ServerSocketAdaptor.java:74) [ERROR] : JSDebugger: at sun.nio.ch.ServerSocketAdaptor.bind(ServerSocketAdaptor.java:67) [ERROR] : JSDebugger: at org.java_websocket.server.WebSocketServer.run(WebSocketServer.java:296) [ERROR] : JSDebugger: at java.lang.Thread.run(Thread.java:764) [WARN] : JSDebugger: (WebSocketWorker-19369) [41050,41129] Debugger client connected {noformat}
This same issue is also seen on Mac-Android.
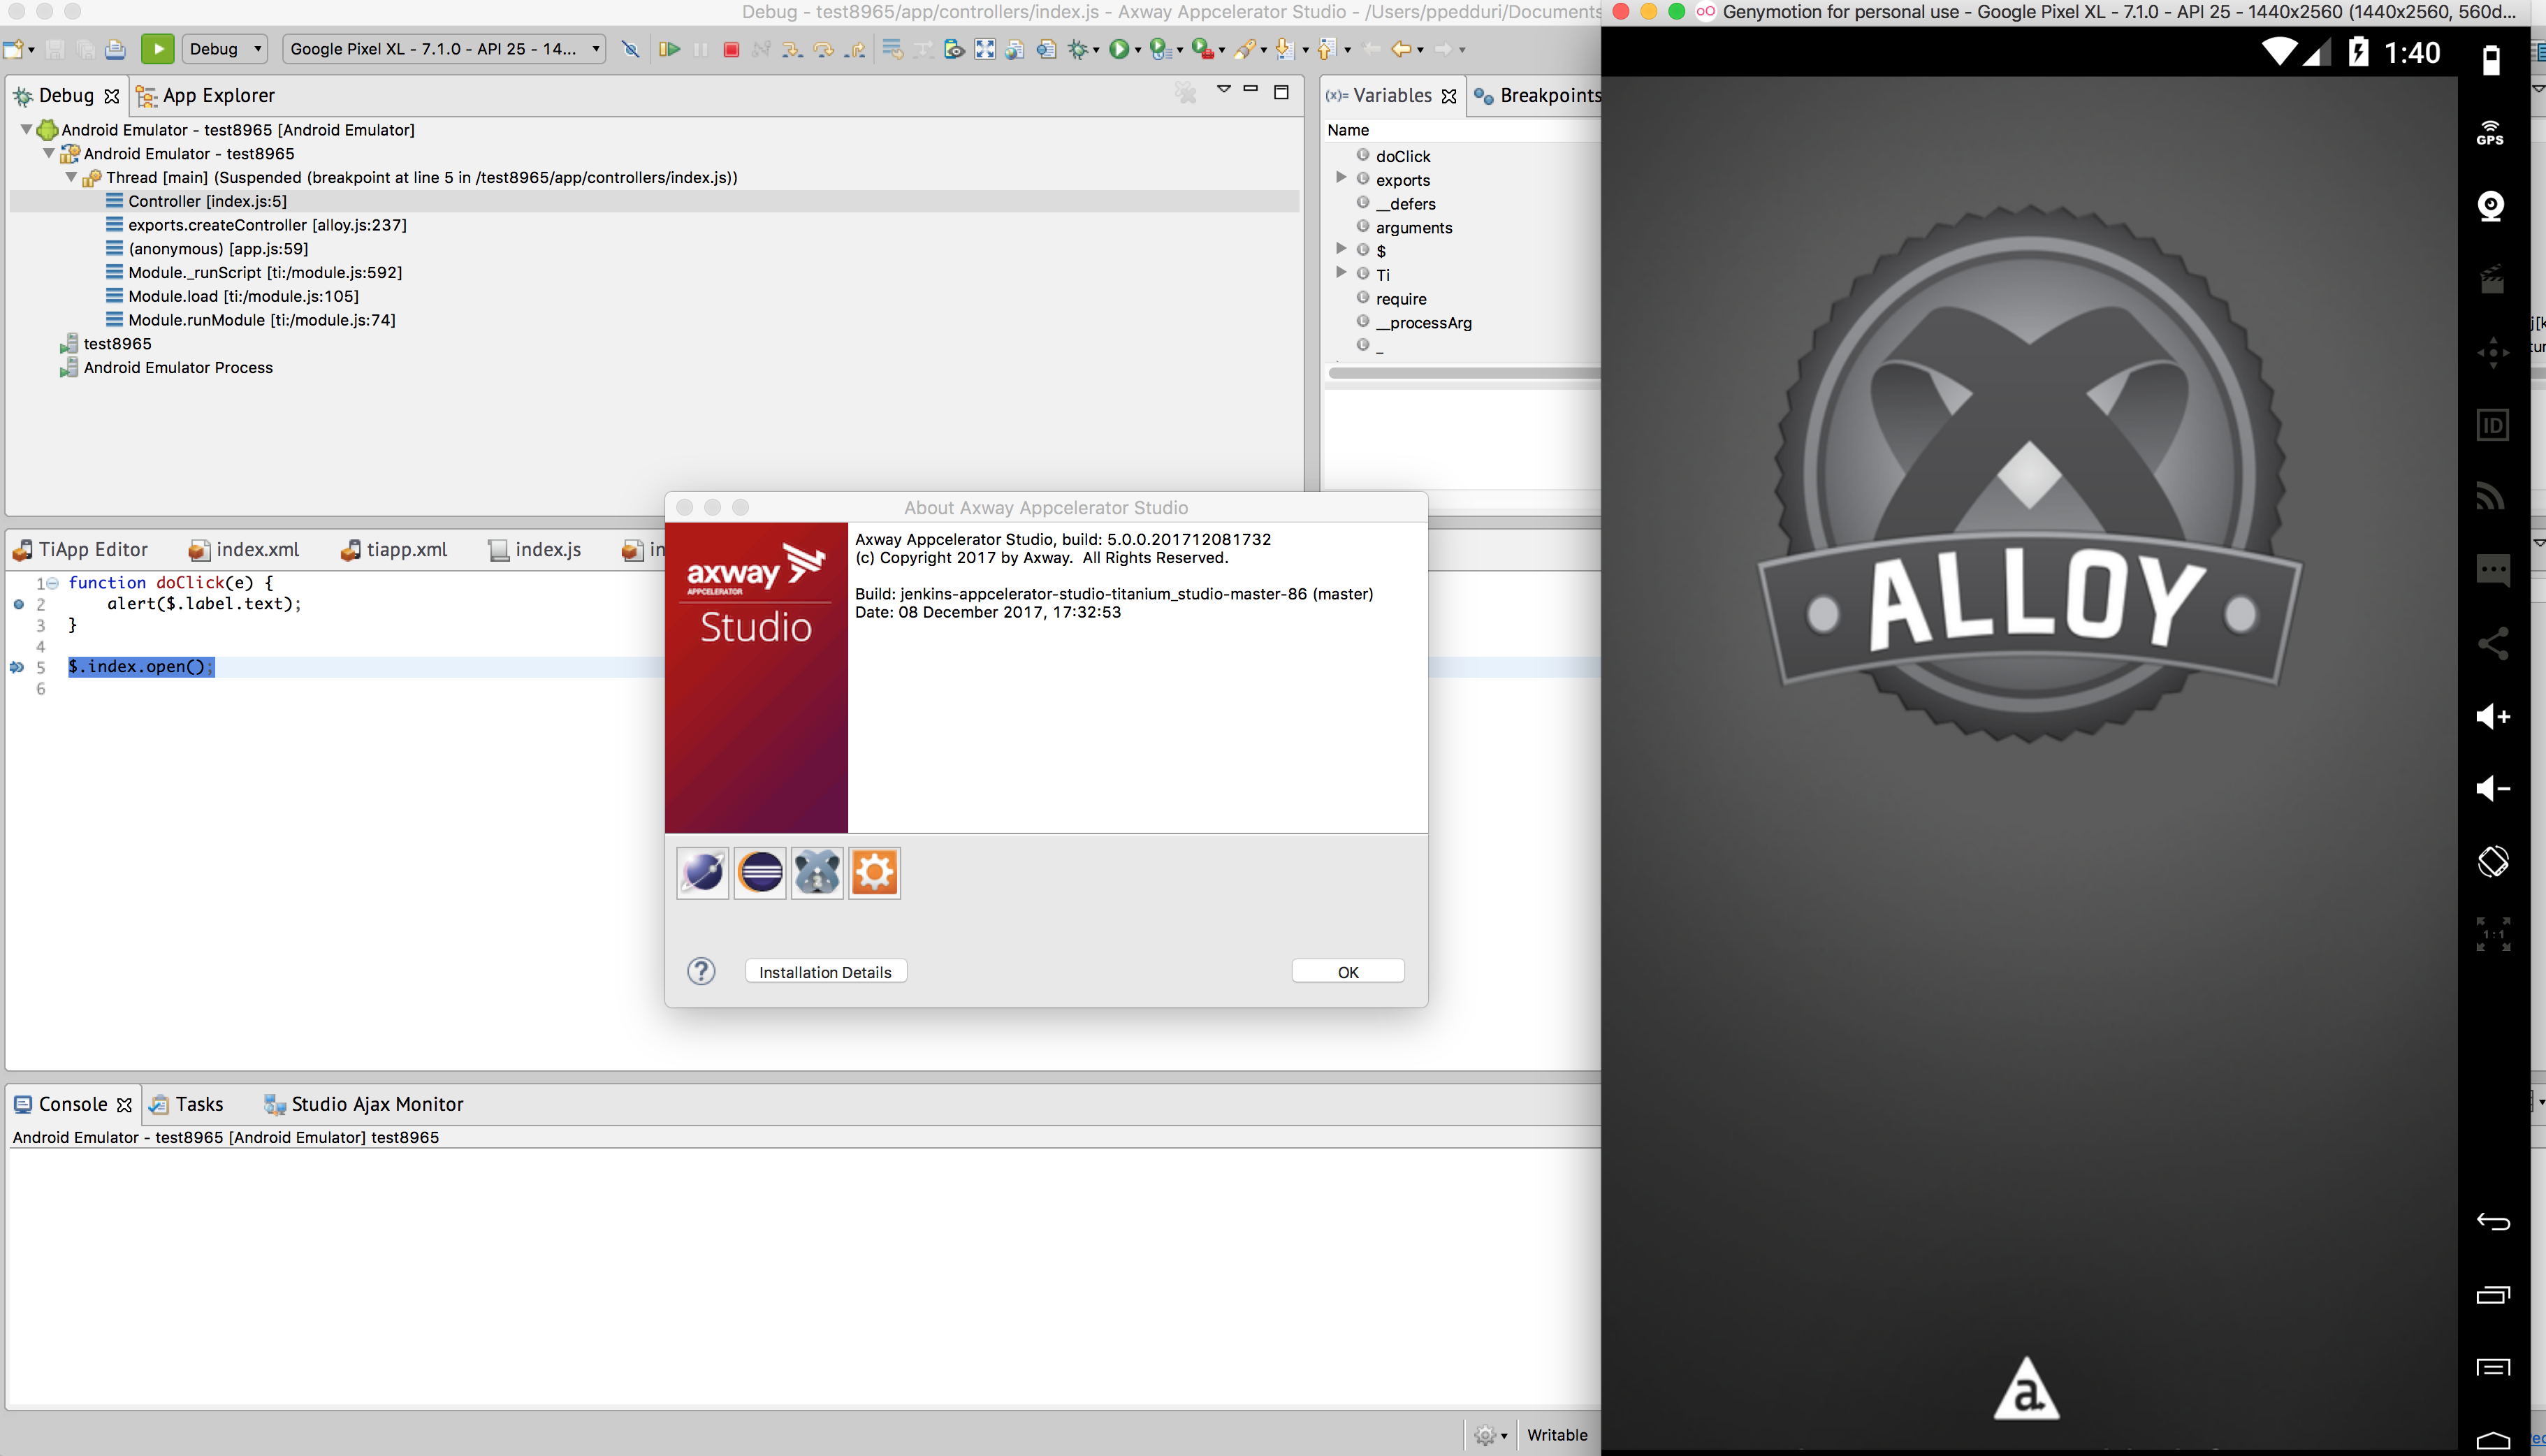
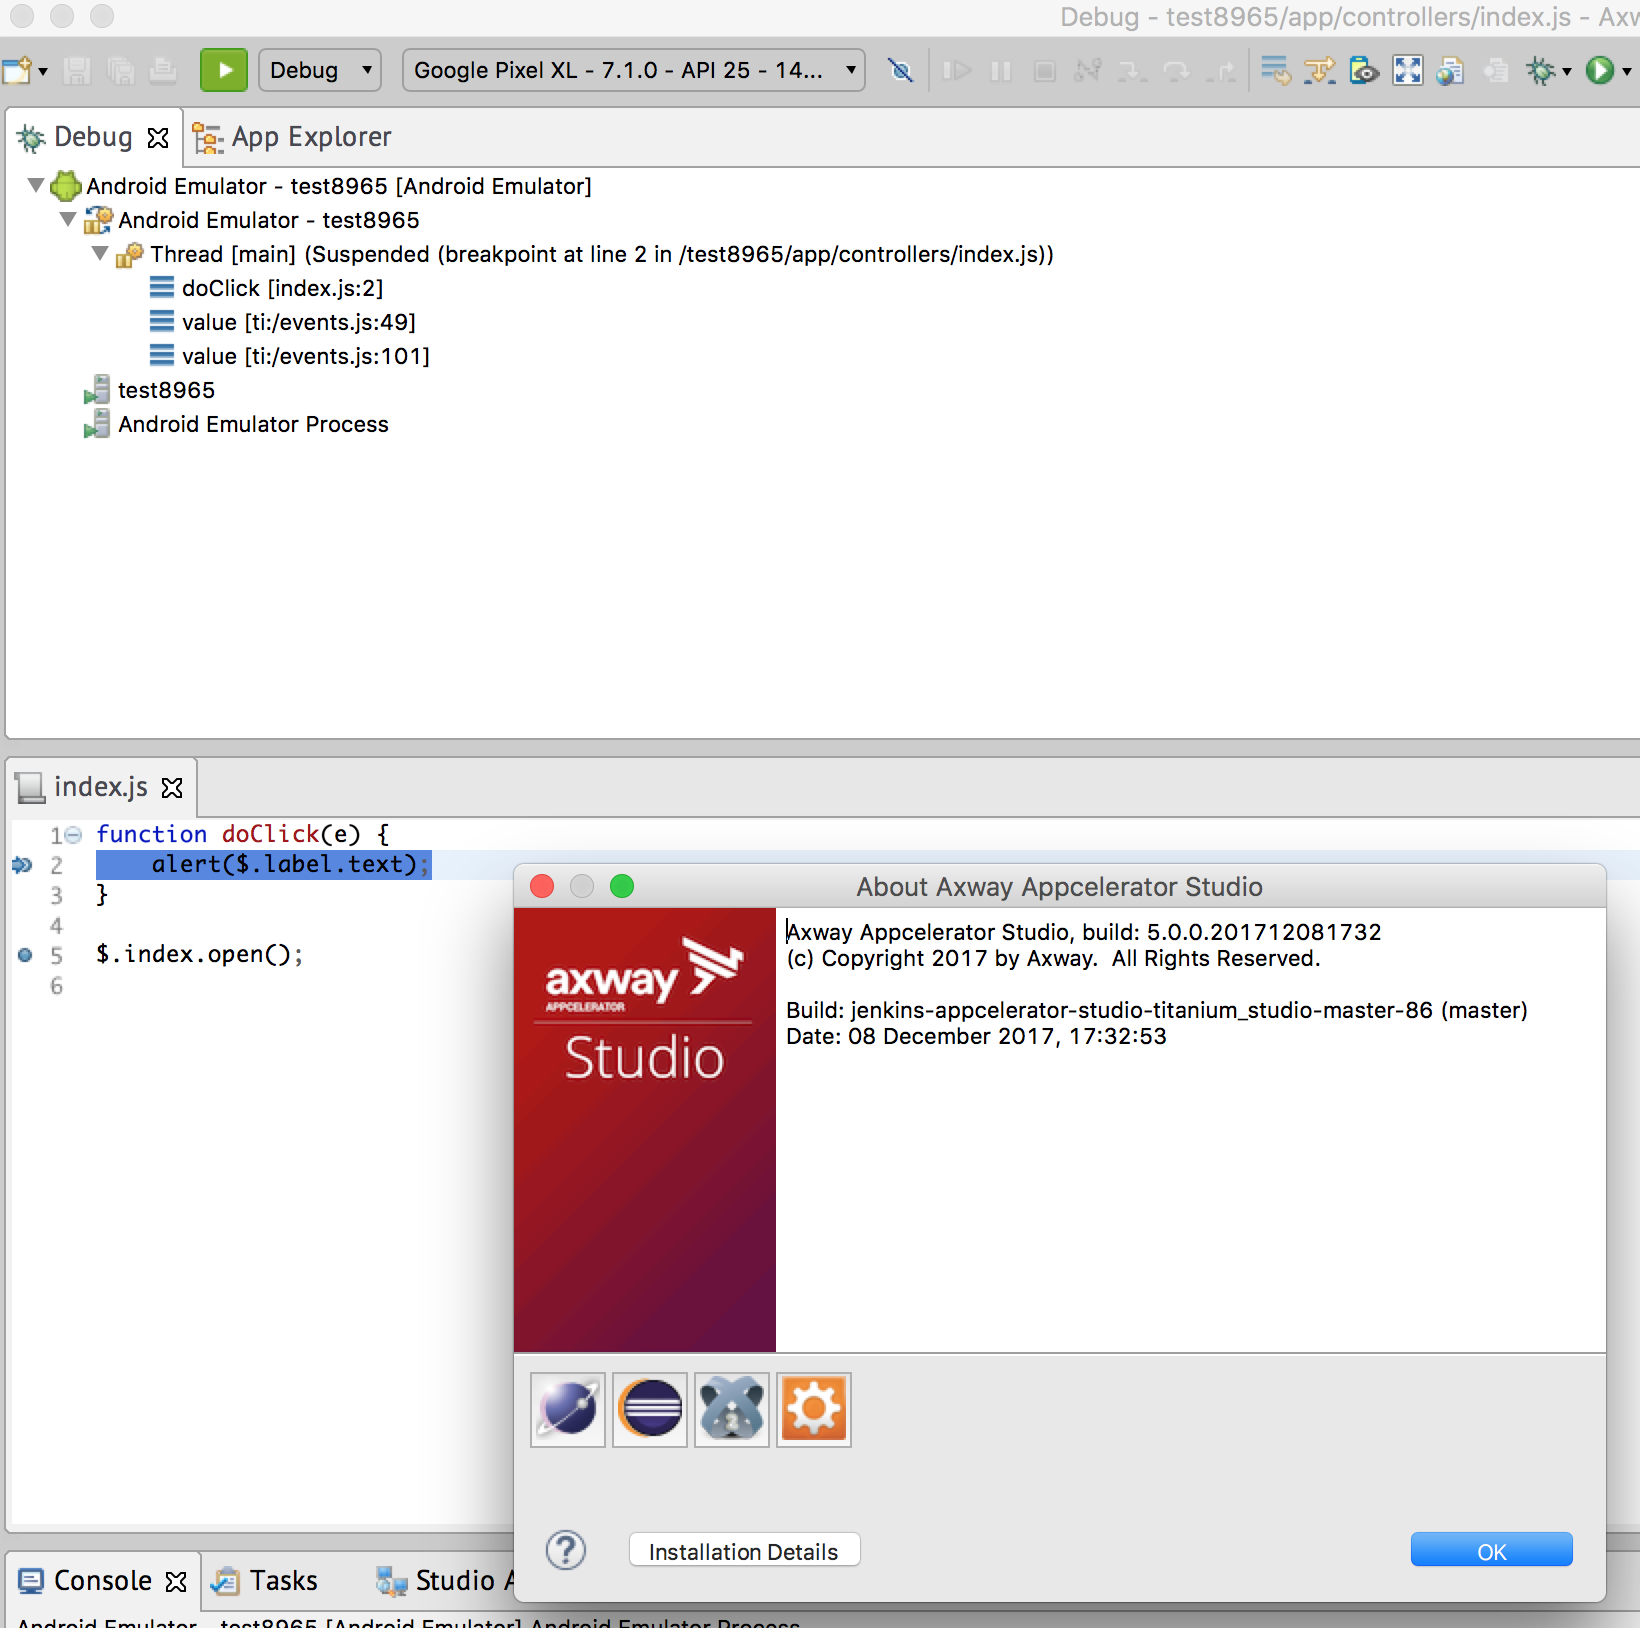
Verified the same use case on MacOS HighSierra 10.13.2 (17C88) and can confirm that it is working fine (all the desired breakpoints are hit) using Android device and Android Genymotion emulators. Also tested this against iOS devices and iOS simulators, and no issue has been observed. *Screenshots*: !Screen Shot 2017-12-19 at 2.40.39 PM.png|thumbnail! & !Screen Shot 2017-12-19 at 2.42.51 PM.png|thumbnail! *Environment*: *_CLI_* - 7.0.1-master.5 *_Ti SDK_*: 7.0.1.v20171218094049 [ *_Node_*: v8.9.1 Will also check this out on Windows and update this thread.
Verified this on Windows 10, and I could reproduce the issue using Genymotion and Android emulators (had some issue with Pixel 2 XL device's app install though, unrelated to Titanium). [~cwilliams], I noticed that the mapping for Android is not properly being generated (Please check the attached files and below log statements for reference). Since we haven't modified anything on Android V8 inspector and Android debugger path within Studio code base, could this be a problem with babble or some underlying map generator? Please advice. Generated index.js --> [^index.js] Actual index.js --> [^index.js] {quote}!ENTRY com.aptana.debug.core 1 0 2017-12-19 20:55:27.083 !MESSAGE (Build 5.0.0.201712081732) [INFO] com.aptana.debug.core/debugger_debug *_Generated mapping while adding breakpoint for L/alyMobApp1/app/controllers/index.js:2 is Resources/android/alloy/controllers/index.js:55_* !ENTRY com.aptana.debug.core 1 0 2017-12-19 20:55:27.208 !MESSAGE (Build 5.0.0.201712081732) [INFO] com.aptana.debug.core/debug [^index.js] ger_debug *_Generated mapping while adding breakpoint for L/alyMobApp1/app/controllers/index.js:5 is Resources/android/alloy/controllers/index.js:58_*{quote} *Edit:* Line numbers 55 and 58 are non existing in the generated index.js.
Corrected title as it works fine for Mac, especially after TISTUD-8966 fix.
*Update*: Analysed this scenario both on Mac and Windows environment. Noticed that its the mapping file (path: *_
PR: https://github.com/appcelerator/alloy/pull/880
For verification be wary that I was unable to see the source when the breakpoint was hit, I filed TISTUD-9049 as this occurs for both classic and alloy apps
Closing ticket, Verified in cli version 7.0.3-master.39
Tried verifying this using latest studio (also using 5.0 GA Studio), on build 7.0.3-master.39, on a Mac. Breakpoint data isn't being returned correctly, there by causing the Studio to ignore the breakpoints set by using in Studio (for both device and simulators) The prior versions of CLI had no issue with this data on Mac. I am yet to verify this on Windows (to see if I encounter TISTUD-9049).