Problem description
Report errors relative to Resources compiled code could display an incorrect Line position.
In the following sample, an wrong function name is used inside a Titanium UI object defined in the Markup .XML.
The function does not exist, Alloy still compile the code and the Code Analyzer completes the analysis.
The function is detected as an error, however the number Line is in this case wrong.
Steps to reproduce
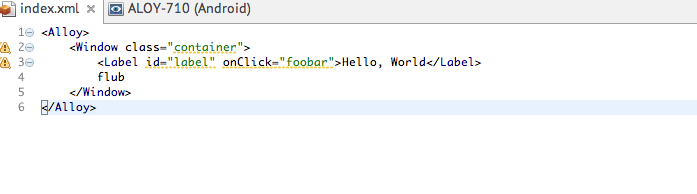
1. Use the following sample code
index.js
<Alloy>
	<Window class="container">
		<Label id="label" onClick="foobar">Hello, World</Label>
	</Window>
</Alloy>
index.tss
"Window":{
	backgroundColor: 'white'
}

"Label":{
	width: Ti.UI.SIZE,
	height: Ti.UI.SIZE,
	color: "#000"
}
index.js
$.index.open();
2. Run the Code Analyzer
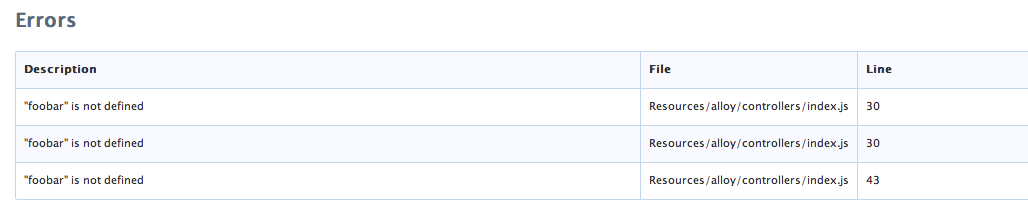
3. Results: "foobar" is correctly reported as not defined. However, the Line position looks wrong.
Attaching screenshot and 'Resources/alloy/controllers/index.js'.
function Controller() {
    require("alloy/controllers/BaseController").apply(this, Array.prototype.slice.call(arguments));
    arguments[0] ? arguments[0]["__parentSymbol"] : null;
    arguments[0] ? arguments[0]["$model"] : null;
    var $ = this;
    var exports = {};
    var __defers = {};
    $.__views.index = Ti.UI.createWindow({
        backgroundColor: "white",
        id: "index"
    });
    $.__views.index && $.addTopLevelView($.__views.index);
    $.__views.label = Ti.UI.createLabel({
        width: Ti.UI.SIZE,
        height: Ti.UI.SIZE,
        color: "#000",
        text: "Hello, World",
        id: "label"
    });
    $.__views.index.add($.__views.label);
    foobar ? $.__views.label.addEventListener("click", foobar) : __defers["$.__views.label!click!foobar"] = true;
    exports.destroy = function() {};
    _.extend($, $.__views);
    $.index.open();
    __defers["$.__views.label!click!foobar"] && $.__views.label.addEventListener("click", foobar);
    _.extend($, exports);
}

var Alloy = require("alloy"), Backbone = Alloy.Backbone, _ = Alloy._;

module.exports = Controller;
Reports errors on line 30, 30 and 43.
Adding a clarification: The Line number reported in the Errors report is not always accurate if is referring to a compiled file in the Resources folder (for example 'Resource/alloy/controllers/index.js'). When the Error is relative to an Alloy file included in the 'app' folder (for example: app/controllers/index.js), the Line number is accurate.
Using both Appcelerator Studio 3.2.3.201404181520 and the CLI (with the code analyzer installed), I do not get code error information included in the output. Perhaps that feature we removed since this ticket was filed. Please note that the error that would result from the app described in this ticket would be encountered at runtime. The JavaScript engine would throw an error when it reached the end of the controller file without being able to find the missing function. Because the error comes from the JS interpreter, I don't see an easy way to catch the error to have it output source-file line numbers rather than compiled (runtime) file line numbers.
Unable to reproduce the issue using: Mac OSX 10.9.4 Appcelerator Studio, build: 3.4.0.201408270900 Titanium SDK build: 3.4.0.v20140827165712 Titanium CLI, build: 3.4.0-dev Alloy: 1.5.0-dev Titanium Code Processor 1.1.1 I added the sample code and then ran the code analysis. There was no error information included in the output, when I ran the code to an Android device I encountered a runtime error for this as predicted by Tim.
Note
Studio does pick this up and *warns* the user to there not being a definition for the method 'foobar'.