[ALOY-847] Could this be a memory leak in Alloy ? (bitmap trapped / Android)
| GitHub Issue | n/a |
|---|---|
| Type | Bug |
| Priority | Low |
| Status | Closed |
| Resolution | Invalid |
| Resolution Date | 2014-01-21T21:35:48.000+0000 |
| Affected Version/s | n/a |
| Fix Version/s | 2014 Sprint 02 |
| Components | Builtins |
| Labels | Alloy, Android |
| Reporter | Kevin Purnelle |
| Assignee | Tim Poulsen |
| Created | 2013-10-10T14:08:45.000+0000 |
| Updated | 2014-02-03T18:39:30.000+0000 |
Description
Hello,
I have been chasing memory leaks and trying to improve memory management in my app. (I use a lot of bitmaps in my app.)
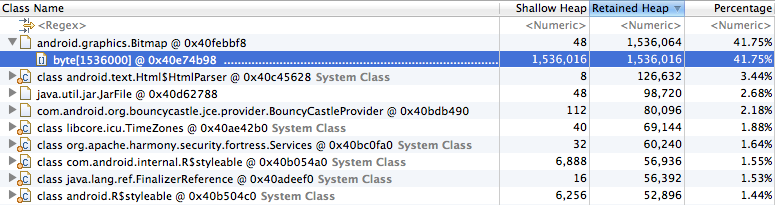
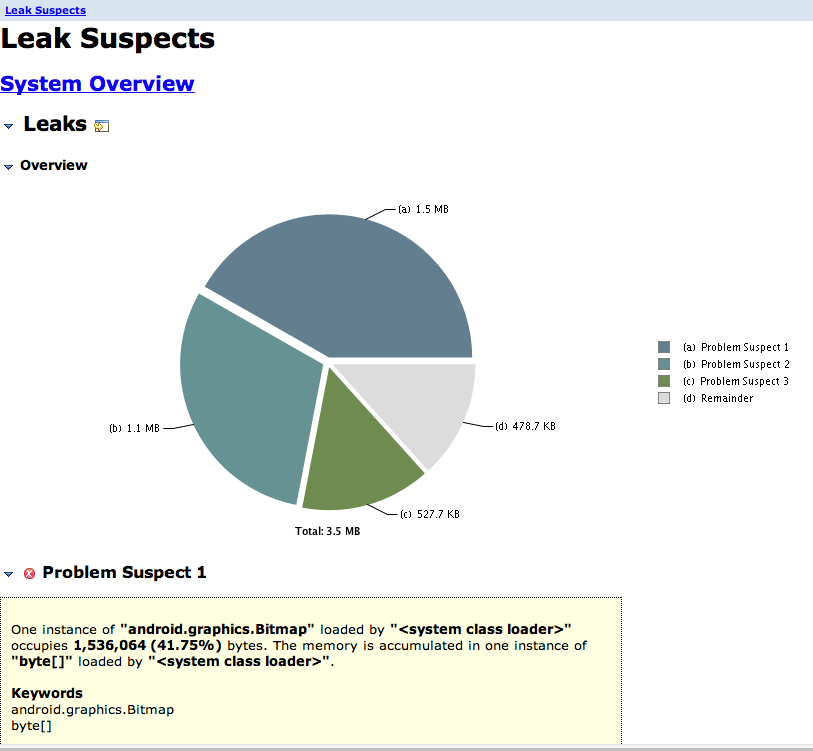
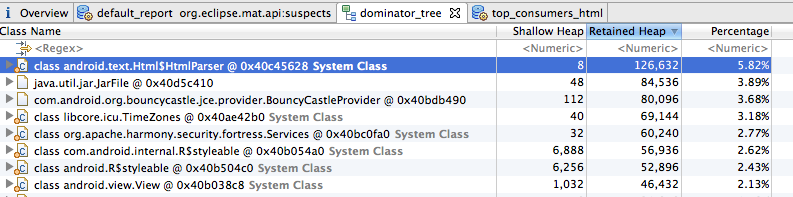
I recently learnt how to use eclipse MAT and discovered a +-1.5 MB bitmap leaking in my app.
In the end I did a really simple test:
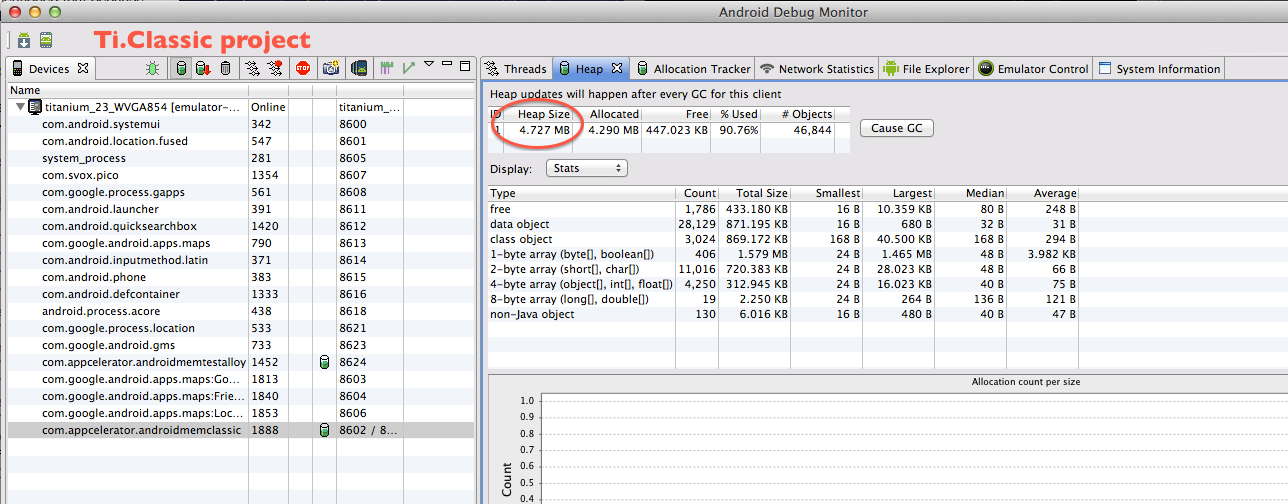
* Create a new classic titanium project without changing anything. Then analyze heap dump.
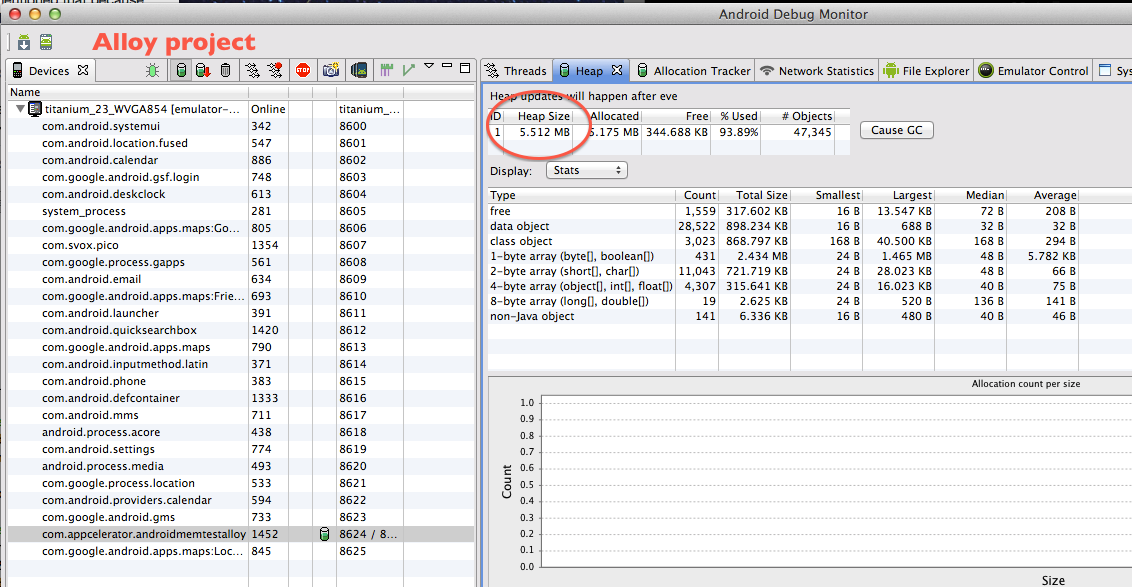
* The same with a new Alloy project.
Difference between both is around 1.5 MB: the bitmap size I've mentioned before.
I suspect Alloy is trapping an image when the app launches. The only image I can come with is the one for the splash screen but I don't really know.
I'll add some screens. If you want to try to reproduce the test it's easy. Just create two new projects like I did. It was tested with Titanium SDK 3.1.2GA Alloy 1.2.2
Attachments
| File | Date | Size |
|---|---|---|
| alloy.png | 2014-01-21T21:30:28.000+0000 | 231602 |
| classic no title.png | 2014-01-21T21:30:28.000+0000 | 206206 |
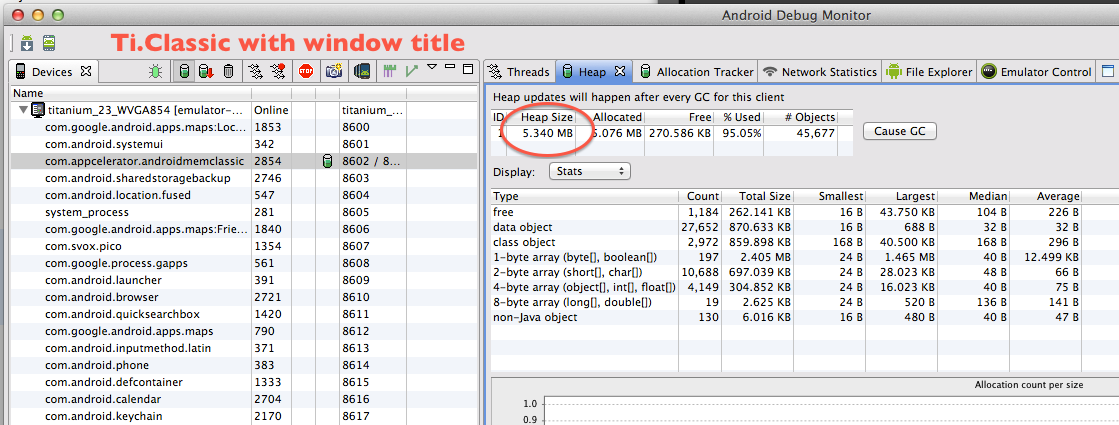
| classic with title.png | 2014-01-21T21:30:28.000+0000 | 191911 |
| Screen Shot 2013-10-10 at 15.07.31.png | 2013-10-10T14:08:45.000+0000 | 79576 |
| Screen Shot 2013-10-10 at 15.24.19.png | 2013-10-10T14:08:45.000+0000 | 66131 |
| Screen Shot 2013-10-10 at 15.30.45.png | 2013-10-10T14:08:45.000+0000 | 77106 |
Sorry here I can not add a title to screenshot. From left to right: 1) and 2) with Alloy. 3) Classic Ti app (no bitmap found there)
Does this "leak" grow over time? It appears that it does not, nor that it affects anything else. Is it just this 1.5 MB image you're worried about?
In my particular case I'm having a serious problem with images being trapped somehow in Android. But I can't find where, except they are kept referenced in some LruImageCache object. (will be for Q&A soon :)) But, this crashes the app after a while. (quite soon actually) It is true, I suppose, that these 1,5 MB are constant and this won't crash an app. But while I was investigating what happens with my code, I found this issue. So I don't know if it's ok or not, to have these 1,5MB taken. I just prefer to mention it. My personal thought on the subject: it's 10% of max heap for Android prior to v3 for what I've read (16MB) (24 MB in recent devices), so it's something. And if it's really a "bug" it still reduces Alloy footprint quite a lot if resolved. With my recent issues, I saw it's easy for an app to crash just because of some bad memory management with images. (quite common problem in Android for what I've seen) That said, is it really worth it? is it really a leak? for that I don't know enough actually to know if I should worry or not.
monitor screens attached
I tested this and find a negligible difference between Alloy and Classic projects, provided the same app is built for both. * Project 1: Alloy, default 1-page app with centered label and window title * Project 2: Classic, default 1-page app using boilerplate code, no window title * Project 3: Classic, hand-coded to match Alloy app, centered label and window title, same click event listener Project 1 and 2 shows roughly 1.5 MB difference in heap use as reported. However, the apps are different because the default classic app has no window title (ActionBar) Projects 1 and 3 show very similar heap use, as shown in the screens I attached.
None of these apps showed growth over time. While the Alloy app uses a small amount of extra heap, the difference is small. There is no memory leak caused by Alloy.